Top open source logging tools for cloud native observability
In the age of cloud native applications and microservices, systems are no longer monolithic but are composed of countless interconnected components working in tandem. This complexity brings a new challenge: how do you ensure everything runs smoothly when a single failure could ripple through an entire ecosystem? Traditional monitoring tools often fall short in such dynamic environments, which is where observability comes in.
Observability is the ability to not just monitor, but deeply understand how systems behave in real time. By focusing on the three pillars— Logs, Metrics, and Traces—it provides a clear view of system performance, helping teams pinpoint issues quickly and maintain reliability even as systems grow more complex. Logging, in particular, is the backbone of observability, offering insights into everything from system errors to performance bottlenecks.
In this blog post, we’ll take a closer look at some of the most popular open source logging tools used in modern cloud native environments: Loki, Parseable, OpenObserve, SigNoz, OpenSearch, VictoriaLogs, Quickwit, and SigLens. We'll compare them based on key factors like ease of use, scalability, data ingestion, querying capabilities, and cost-efficiency to help you choose the best tool for your needs.
Why Observability?

You might be asking, "Why do I need observability?" It’s more than just monitoring. Monitoring can tell you when something’s wrong, but observability lets you understand why something’s wrong.
Think of it like this: Just like a doctor needs a thorough understanding of your body’s symptoms to diagnose the issue, Observability provides insights into system health using open source logging tools alongside logs, metrics, and traces, crucial for cloud native applications. It allows you to effectively identify bottlenecks, troubleshoot issues, and optimize performance in distributed, cloud native environments.
Logz.io recently shared some fascinating insights on how organizations can improve their operational efficiency. According to their research:
-
Limited full observability: Only 10% of organizations have full observability of their entire tech stack, while 36% are partially along the journey, and 20% plan to start.
-
Lack of knowledge hindering observability: 48% of organizations cite a lack of knowledge among teams as the biggest barrier to achieving observability in cloud native environments, up from 30% in 2023.
-
Cost pressures on observability: 91% of organizations are taking steps to reduce observability costs, such as optimizing monitoring expenses (52%), adjusting data management practices (38%), or reducing monitoring data collection (32%).
-
MTTR trends: 82% of organizations report an MTTR of over an hour, marking a continuous rise over the past three years (74% in 2023, 64% in 2022, and 47% in 2021).

What is Logging?
Logging is the process of capturing and recording events or messages that occur within a system, application, or service. Logs, a fundamental aspect of cloud native observability, provide detailed insights into the system’s state, including errors, warnings, or even debug information that might help troubleshoot issues.
Logs are the first line of defense in identifying and diagnosing issues across microservices architectures. They give you the data to understand how your system is behaving, enabling you to spot performance bottlenecks, failures, and other operational challenges.
According to recent reports from Logz.io, organizations leveraging robust logging solutions have been able to reduce incident resolution times by 30% on average. Furthermore, 72% of enterprises report that their observability tools have significantly improved their system uptime and user experience. This demonstrates the value of integrating a strong logging tool into your cloud native infrastructure.
Let's look into some of the popular open source logging tools in the market today:
Loki
Grafana Loki is an open source, horizontally scalable, multi-tenant log aggregation system. Unlike other traditional log management solutions, Loki is designed to work efficiently if the queries are written properly. Its primary strength lies in its ability to index and store logs in a manner that allows for powerful querying and visualization. Loki, the open source logging tool, was developed by Grafana Labs as part of the wider Grafana ecosystem, which is popular for its ability to visualize logs.
Key features of Grafana Loki
- Scalable and efficient: Handles large log volumes with a fault-tolerant, distributed architecture.
- Prometheus integration: Correlates logs and metrics in Grafana for easier troubleshooting.
- Simplified querying: Uses LogQL for powerful, simple log queries.
- Label-based indexing: Indexes metadata (labels) instead of full log content, saving storage and resources.
How does it work?
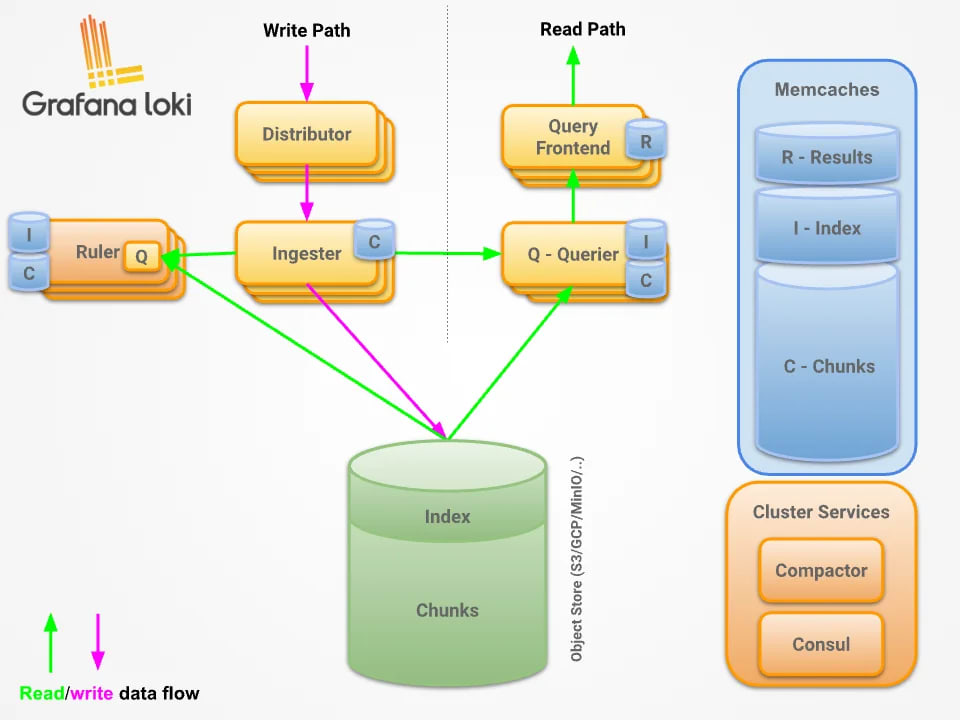
A typical Loki-based logging stack consists of three components:
- Agent (e.g., Promtail): Collects logs, adds labels, and sends them to Loki.
- Loki: Ingests, stores, and processes logs.
- Grafana: Allows users to query and visualize logs stored in Loki.
Limitations:
- Limited full-text search: Loki only indexes metadata, so complex searches on log content can be less efficient.
- External storage: Requires external storage (e.g., AWS S3) for long-term log storage.
- Query performance at scale: Query performance can degrade with very large datasets, requiring optimization.
- Log parsing: Loki has limited built-in log parsing, often requiring external tools for preprocessing.
- Memory intensive: Loki can be memory-intensive, especially when querying large datasets. There are some other open source logging tools that are more memory efficient because of they use better storage formats such as AVRO or Parquet.
Parseable
Parseable is a log management tool designed to enhance log querying and visualization through efficient parsing mechanisms. It integrates with various logging systems, including Grafana Loki, to enable deep log analysis with minimal resource consumption. Parseable focuses on simplifying the log data interpretation process, making it easier for users to search, filter, and aggregate logs without the need for complex configurations.
Features
- Efficient log querying: Simple yet powerful querying for filtering and aggregating logs.
- Easy log parsing: Transforms raw logs into structured data for better analysis.
- Integration with Grafana: Seamlessly integrates with Grafana and Loki for direct log visualization.
- Scalability: Scales horizontally to handle logs from large distributed systems.
How does it work?
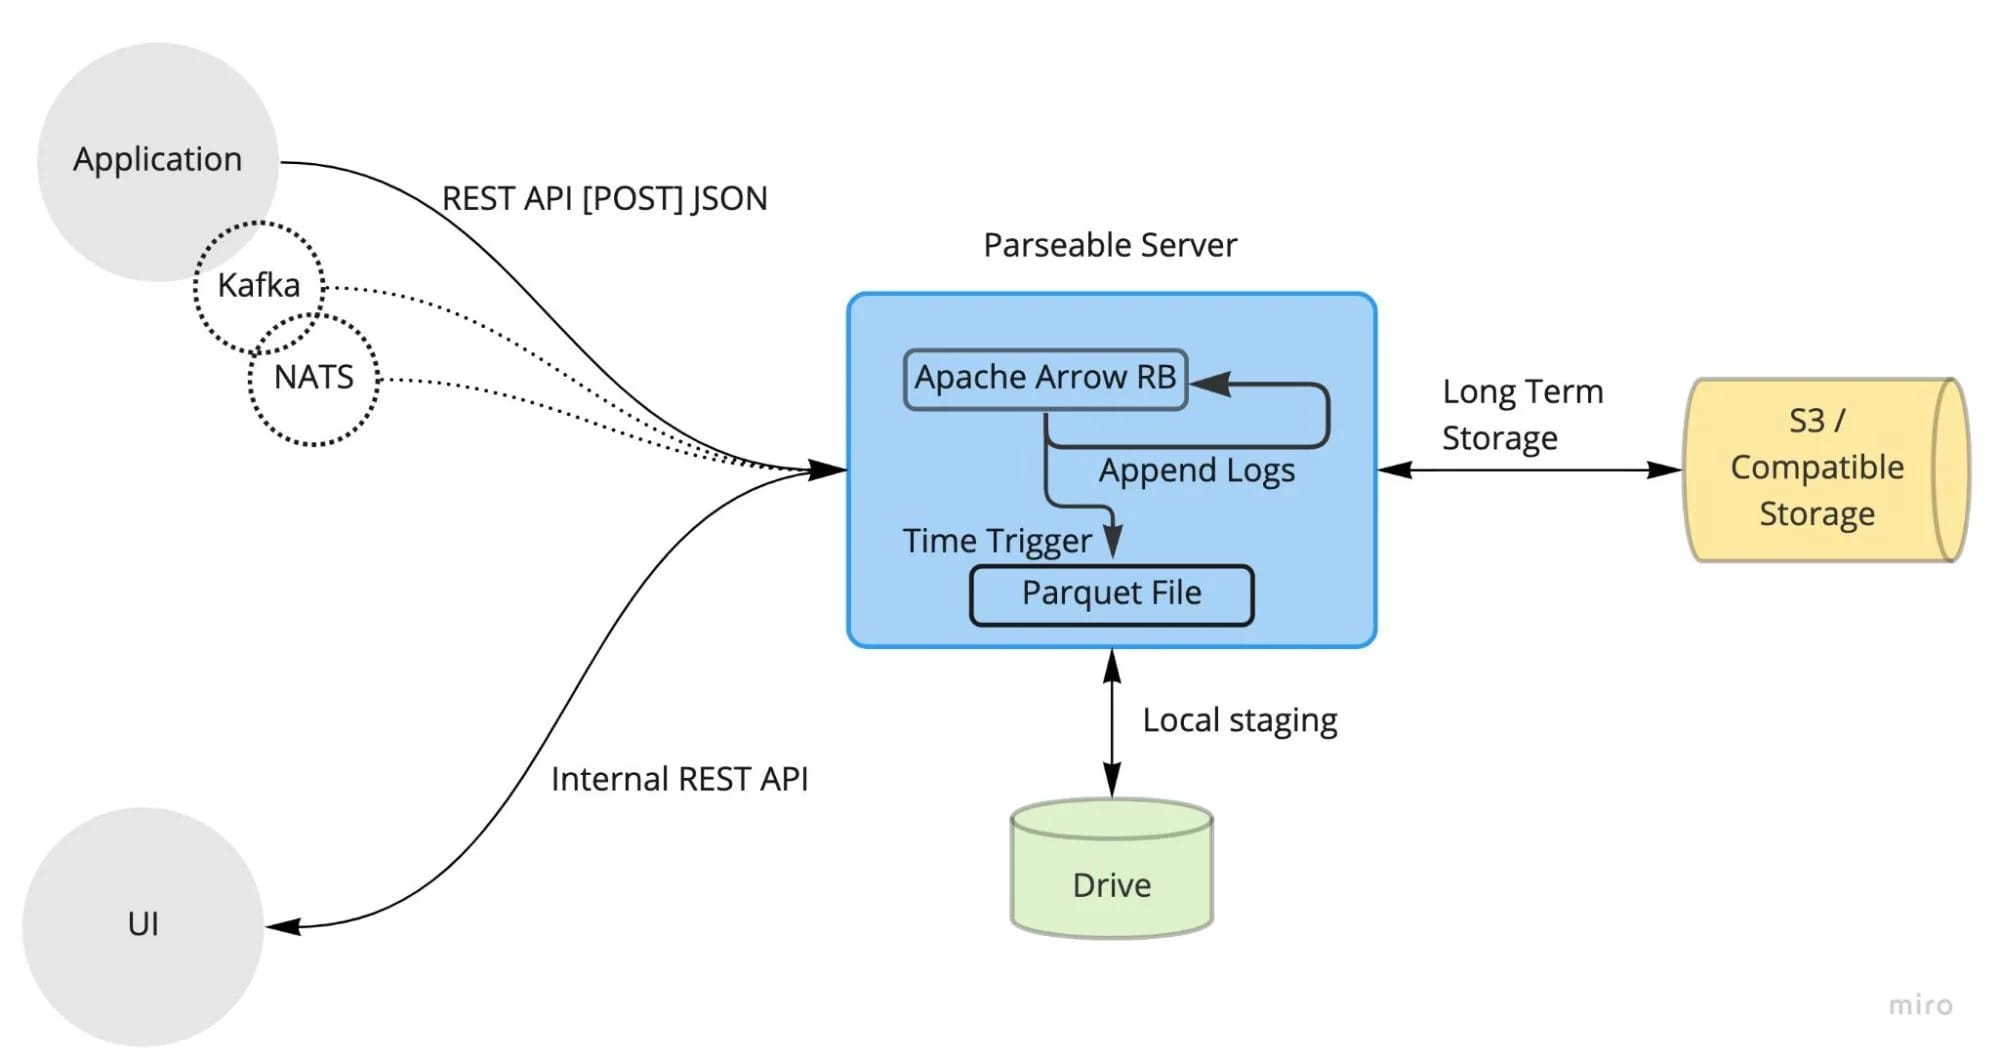
Parseable provides HTTP REST API endpoints for efficient log stream creation, ingestion, query, and management. It supports integration with common logging agents like FluentBit, LogStash, and Vector. Additionally, it offers an intuitive GUI for easy log navigation and querying.
Limitations
- Limited log content parsing: Requires external tools for complex log parsing and transformation.
- Dependency on external tools: Relies on other log aggregation tools like Grafana Loki for full functionality.
- Scalability constraints: Though scalable, very large volumes of logs may require optimization for performance.
- Young project: Parseable is a relatively new project and may lack maturity as we write this article.
OpenObserve
OpenObserve is an open source observability platform designed for high-performance log aggregation, storage, and analysis, optimized for scalability in cloud native environments. It enables real-time log collection, analysis, and visualization with minimal overhead.
Features
- High-performance log aggregation: Efficiently handles large volumes of log data with minimal resource consumption.
- Real-time querying: Powerful native query language for searching and analyzing logs in real-time.
- Cost-effective storage: OpenObserve helps you minimize costs by offering long-term storage at a fraction of the cost compared to other tools. With its optimized data compression and efficient storage mechanisms, you can store logs and metrics without worrying about escalating costs.
- RESTful API: Provides API endpoints for log stream creation, ingestion, and querying.
How Does It Work?
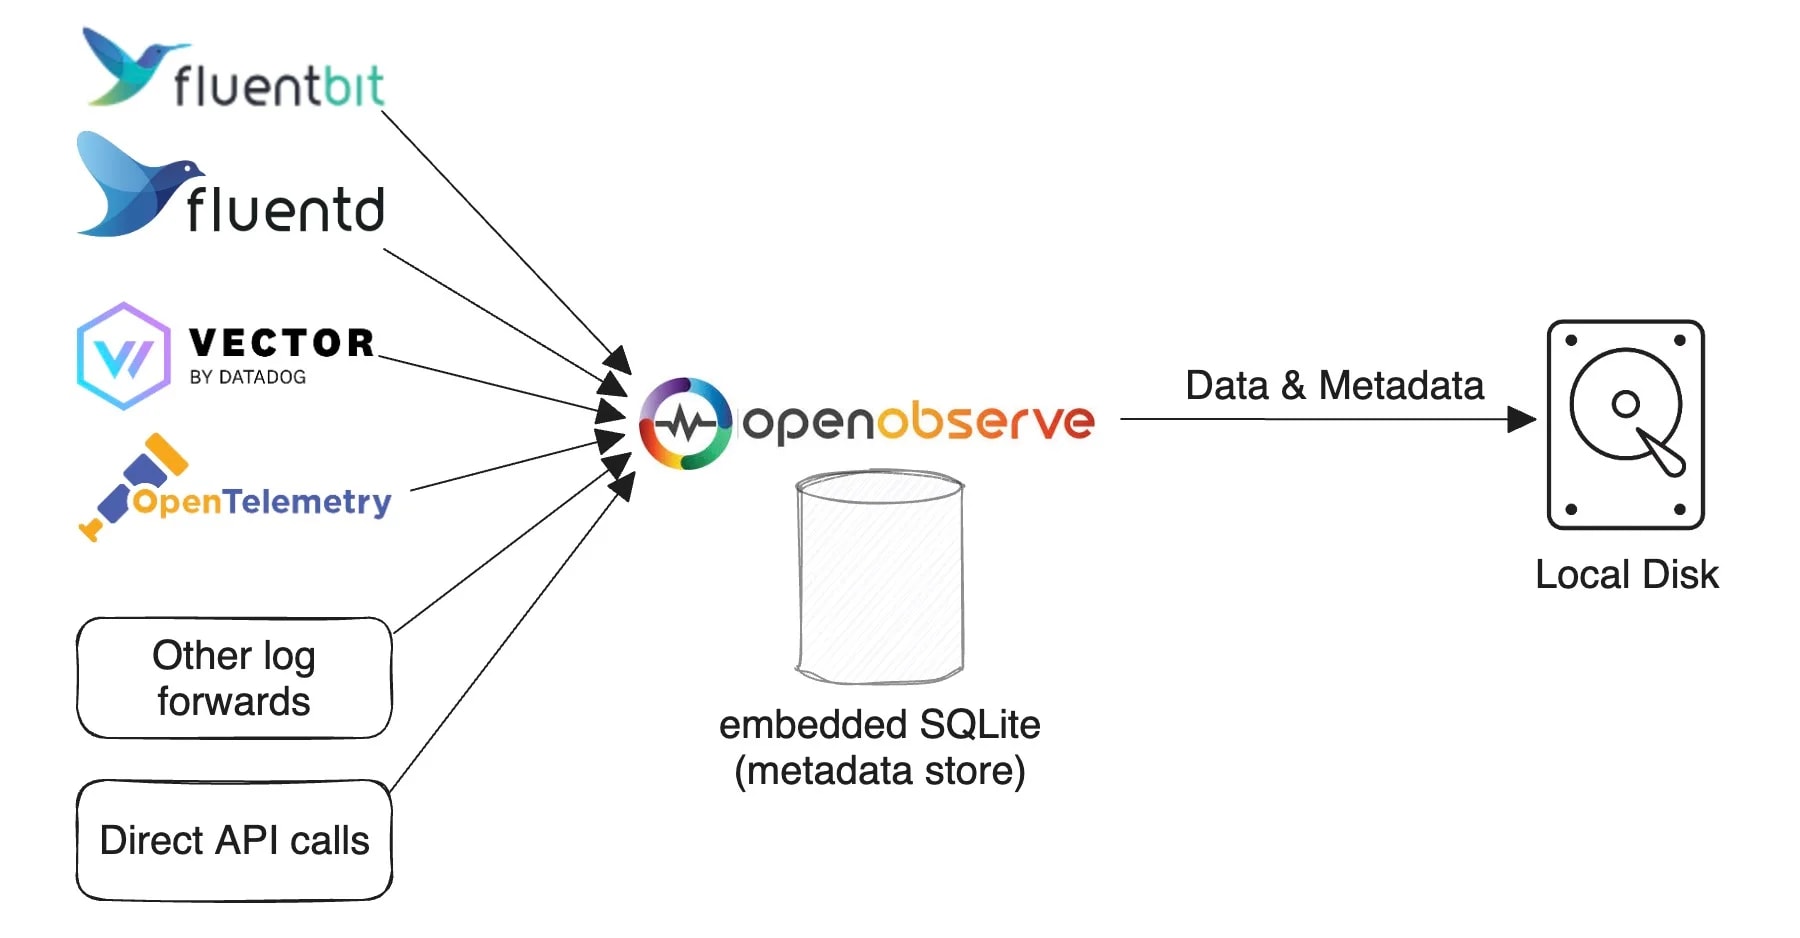
OpenObserve operates by ingesting logs from various sources through standard logging agents like Fluentd or Logstash. The logs are processed, indexed, and stored in a way that allows for quick querying and analysis. The platform provides a native query language for log analysis and integrates with tools like Grafana for visualization. OpenObserve also exposes an easy-to-use GUI for users to interact with their log data directly.
Limitations
- Lack of APM features: OpenObserve does not offer Application Performance Monitoring (APM) features, which are essential for monitoring application performance and identifying bottlenecks. Teams looking for comprehensive observability solutions may need to integrate OpenObserve with other APM tools to achieve full visibility into their applications.
- Limited SIEM capabilities: OpenObserve is not a full-fledged Security Information and Event Management (SIEM) solution; however, it does offer some capabilities that can support security monitoring. Its focus is primarily on application observability rather than extensive security monitoring and incident response functionalities typically expected from SIEM tools
- Young project: OpenObserve is a relatively new project and may lack some advanced features found in more mature observability platforms. Users may need to contribute to the project or integrate with other tools to meet specific requirements.
SigNoz
SigNoz is an open source full-stack observability platform for monitoring and troubleshooting distributed systems. It provides powerful tools for tracing, metrics, and log aggregation, optimized for high performance and scalability in cloud native and microservices environments.
Features
- Distributed Tracing: Tracks requests across microservices to identify performance bottlenecks.
- Metrics and Dashboards: Visualizes key performance indicators (KPIs) through custom dashboards.
- Log Aggregation: Integrates log collection with traces and metrics for comprehensive observability.
- OpenTelemetry Support: Collects metrics, logs, and traces using a common standard for seamless integration.
How does it work?
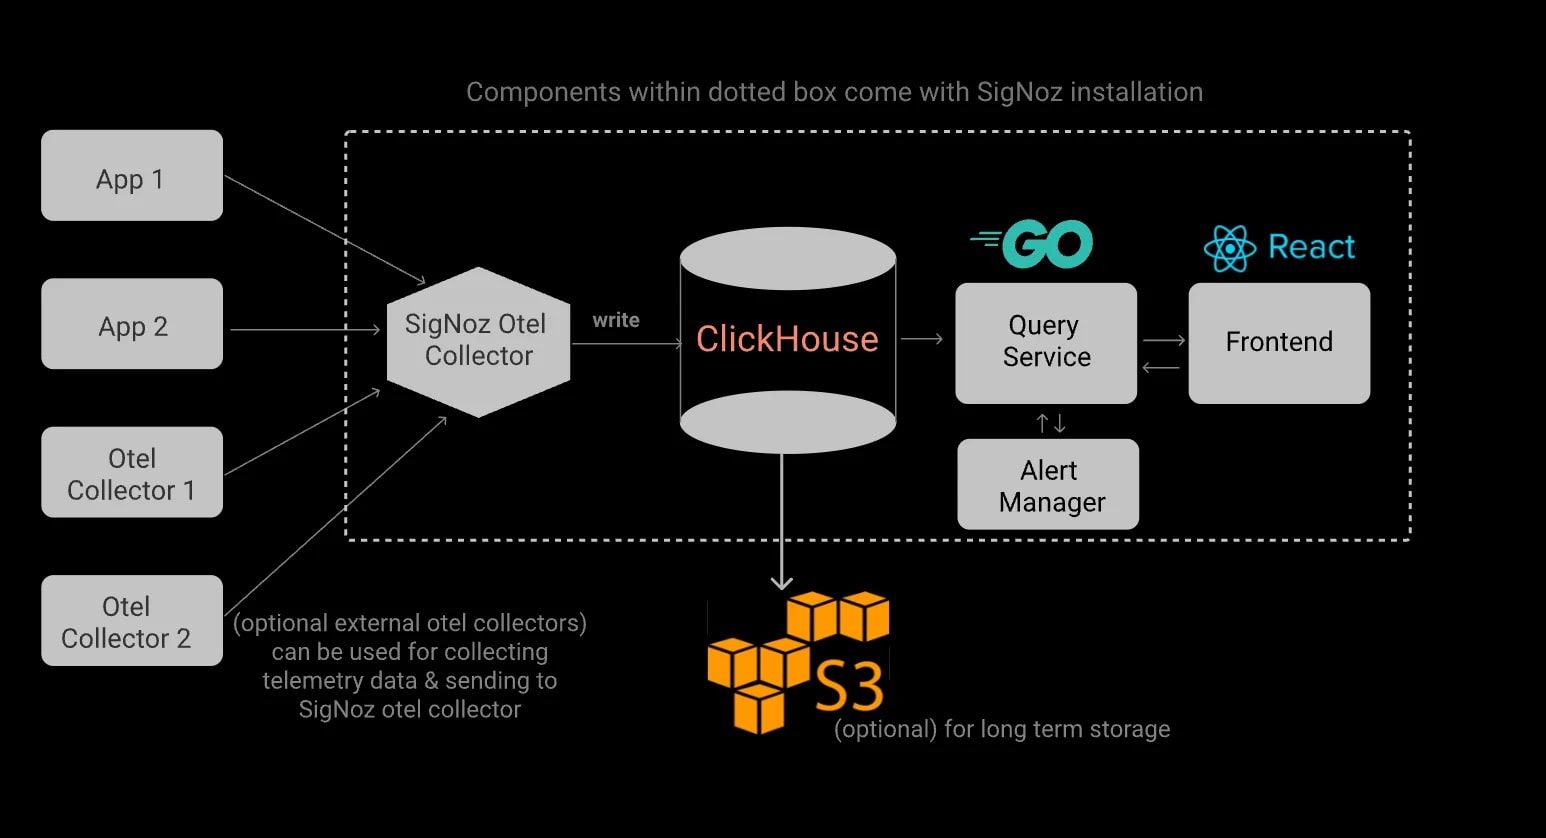
SigNoz collects and processes traces, metrics, and logs from applications, stores the data, and offers real-time querying.
Limitations
- High resource usage: Can be resource-intensive, requiring careful infrastructure management at scale.
- Storage management: Efficient storage management is needed for large data volumes.
- Grafana integration: There is no Grafana integration available and has been a request from the community from a long time. The native UI is not as feature-rich as Grafana.
- Limited advanced features: May lack advanced analytics or machine learning features, requiring integration with additional tools for predictive analysis.
OpenSearch
OpenSearch is an open source search and analytics suite derived from Elasticsearch, designed for real-time log analytics, search, and observability. It excels at analyzing and visualizing large datasets, making it suitable for log aggregation, application monitoring, and data exploration.
Features
- Real-time search and analytics: Enables quick analysis of large datasets for real-time observability.
- Full-text search: Supports efficient searching through unstructured data.
- Distributed architecture: Scales horizontally across distributed clusters for optimal performance.
- Integration with OpenSearch dashboards: Provides rich visualization tools for real-time analytics.
How does it work?
OpenSearch indexes and stores data across distributed clusters, supports RESTful API interactions, and provides fast querying capabilities. It ingests data from various sources, including logs and metrics, and presents insights through OpenSearch Dashboards.
Limitations
- Ingestion limitations: OpenSearch can only ingest data into domains running version 1.0 or later.
- Performance degradation at scale: Requires careful optimization to maintain performance at large scales.
- Field data and aggregation memory limits: Large aggregations can lead to high memory consumption, particularly on text fields. Users must manage heap usage and document scanning limits to avoid performance issues.
- Advanced querying limitations: Highly specific queries may require fine-tuning for efficiency.
SigLens
SigLens is an observability platform focused on real-time log analysis, metrics monitoring, and distributed tracing. It simplifies troubleshooting and performance optimization for cloud native and distributed systems.
Features
- High scalability: Handles large-scale deployments efficiently.
- Powerful query language: Advanced querying for deeper insights into data.
- Visualization dashboards: Custom dashboards for tailored analysis and monitoring.
- Seamless integrations: Works with Kubernetes, Prometheus, and FluentBit.
How does it work?
SigLens ingests logs, metrics, and traces, indexes the data, and stores it in a scalable backend. Users interact with data through query interfaces and visualization dashboards to gain insights into system health and performance.
Limitations
- Resource Intensive: High resource consumption for large-scale environments.
- Storage Costs: Long-term data retention may increase infrastructure costs.
- Lack of maturity: It is a new project so try with your own risk.
Quickwit
Quickwit is an open source search engine optimized for high throughput and low latency, designed to efficiently handle large-scale data like logs and events. It is build on tantivy, a full-text search engine library in Rust, and is suitable for real-time search and analytics in cloud native environments. Some companies like Binance is using Quickwit at scale (100PB) which seems to be a promising for a new project.
Features
- Real-Time Search: Fast, low-latency querying for large datasets.
- Distributed Architecture: Scales horizontally across multiple nodes.
- Full-Text Search: Advanced features like stemming, tokenization, and ranking.
- Customizable Indexing: Fine control over data indexing and querying.
How does it work?

Quickwit ingests and indexes data in real time using an inverted index structure for fast lookups. It can scale horizontally and integrates with Kafka for real-time data processing.
Limitations
- Limited Ecosystem: Fewer third-party integrations than established engines.
- Young Project: Some features may be less mature.
VictoriaLogs
VictoriaLogs is an open-source log management solution designed for high-performance log analysis, enabling users to efficiently process and visualize large volumes of log data. It is one of popular product from the makers of VictoriaMetrics, a high-performance time-series database. When compared to products like Loki, it is easier to setup and operate, faster (1000x better than Loki as per the claim) and efficient.
Features
- High Throughput: Capable of ingesting and processing large volumes of logs in real time.
- User-Friendly Interface: Intuitive dashboard for easy navigation and log visualization.
- Advanced Query Capabilities: Supports complex queries for detailed log analysis.
- Integration Support: Works seamlessly with various data sources and monitoring tools.
How does it work?
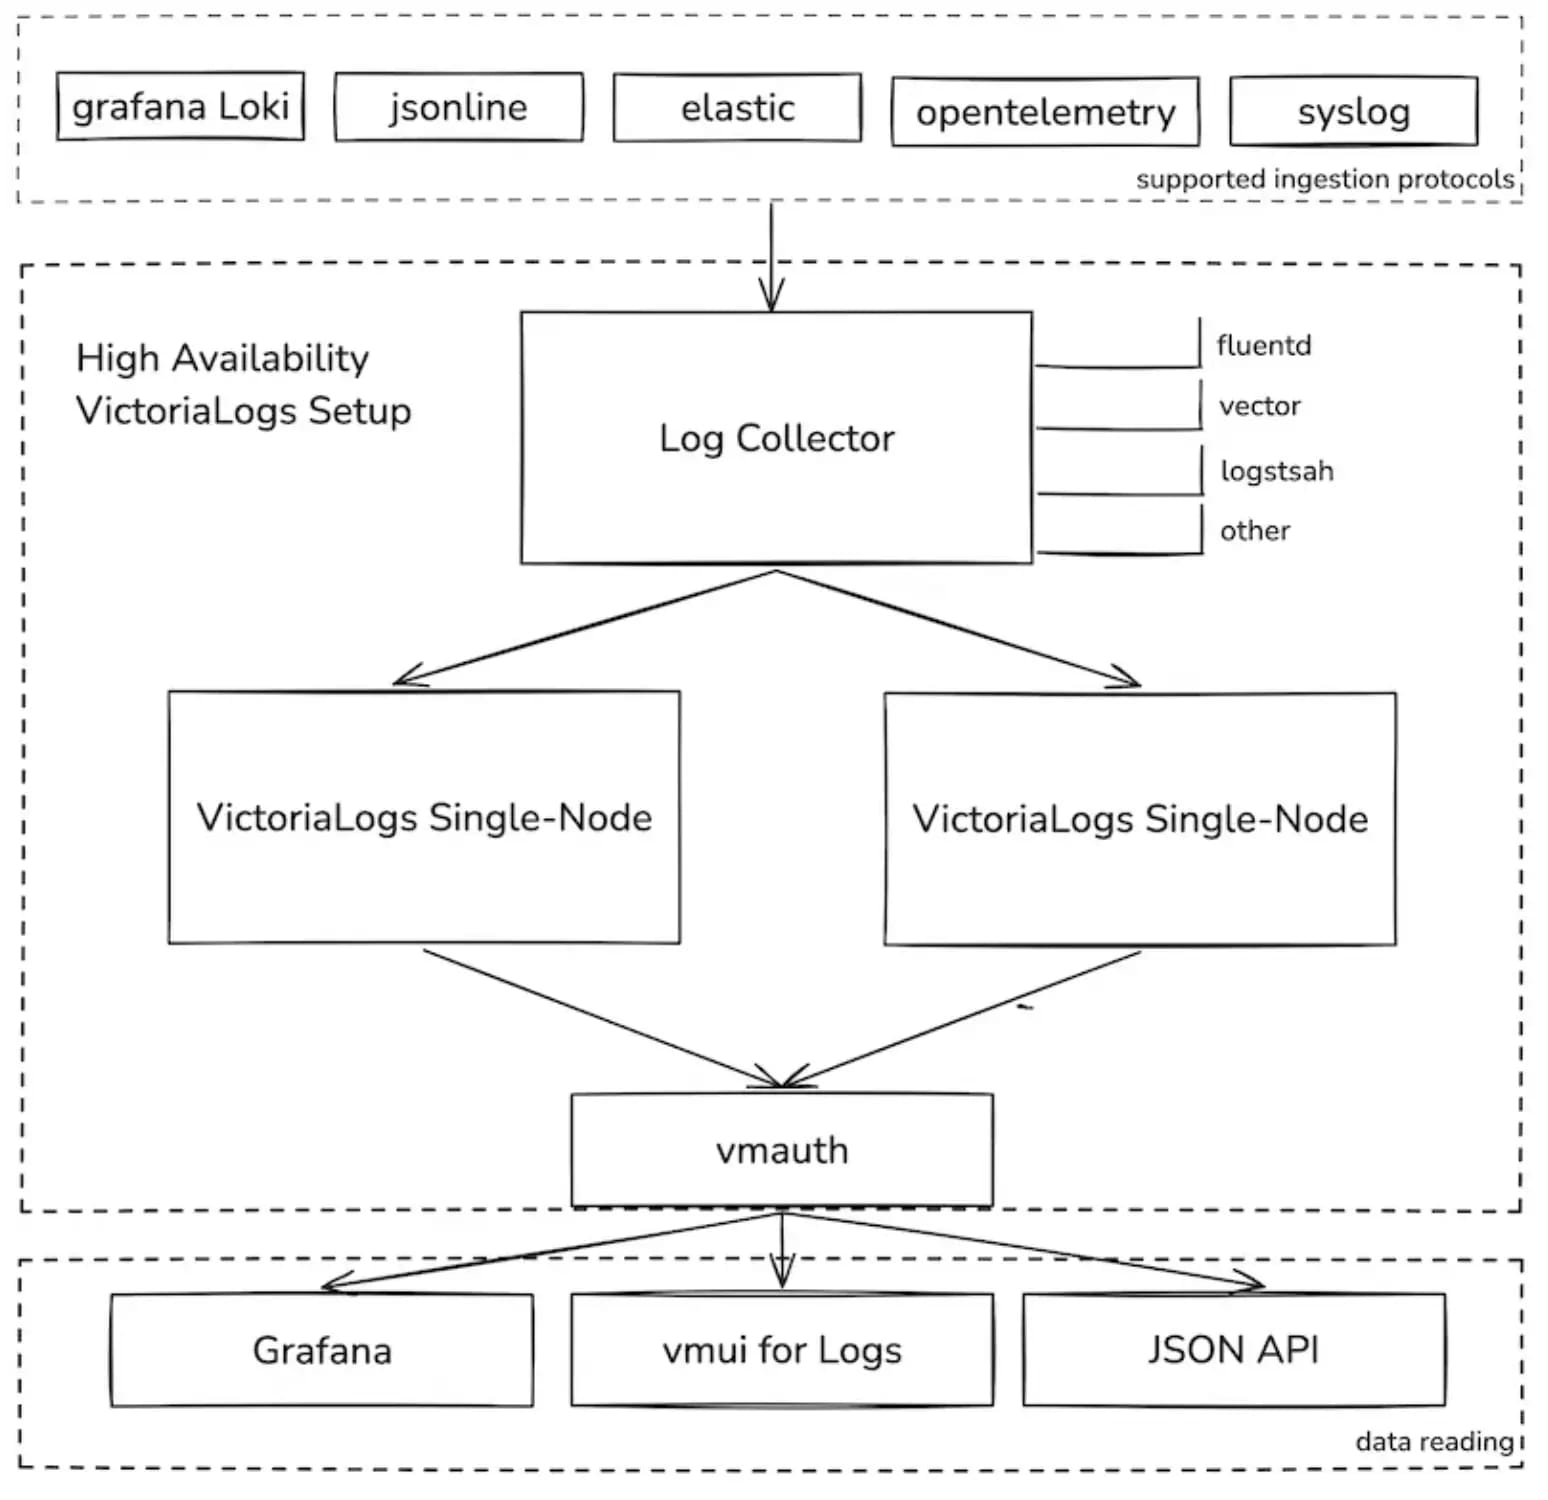
VictoriaLogs utilizes a distributed architecture to ingest and index logs quickly, employing an inverted index structure for efficient searching. It can integrate with various data pipelines and supports real-time data processing, making it suitable for modern logging needs.
Limitations
- Memory management:: VictoriaLogs does not currently implement a rejection mechanism for log files that exceed the memory size allocated to the pod. This can lead to Out Of Memory (OOM) errors in Kubernetes environments, resulting in the service becoming unavailable and potentially losing log data depending on your architecture choice.
- Limited documentation and features: As a relatively new system, VictoriaLogs is still evolving and may lack comprehensive documentation or certain advanced features found in more established systems like Grafana Loki or Elasticsearch
Comparison of open source logging tools

Which tool is best for your Organization?
Selecting the right observability tool is a strategic decision, shaped by your business goals and operational needs. Engage with us to explore the best open source logging tools for your cloud native environment. Our experts can help you evaluate your requirements, assess tool capabilities, and implement the right solution for your organization.
Conclusion
Open source logging tools empower organizations with the scalability, flexibility, and seamless integration needed to extract actionable insights while keeping costs under control. Unlike proprietary solutions, open source tools eliminate vendor lock-in, giving teams the freedom to adapt, customize, and optimize their observability stack to meet evolving business needs.
By leveraging open source solutions, your organization benefits from a thriving community, continuous innovation, and long-term cost savings, leading to an improved return on investment. Adopting the right toolset ensures better system reliability, faster troubleshooting, and enhanced decision-making, ultimately driving operational efficiency in cloud-native environments. Stay ahead by embracing open source and building a resilient, future-proof observability strategy.
Disclaimer: The information provided in this article is based on the author's research and may not reflect the latest updates of the mentioned tools. Please refer to the official documentation of each tool for the most up-to-date information.
Updates
- updated on 2025-01-07: Added VictoriaLogs to the list of open source logging tools.
Maximize ROI with Open Source Observability
Unlock cost savings, eliminate vendor lock-in, and gain deeper insights into your systems with open-source observability solutions. Let our experts help you build a scalable and resilient monitoring strategy.
