


Introduction
Large Language Models (LLMs) have revolutionized cloud-native AI, powering applications from support bots to analytics engines. However, scaling LLMs in production introduces new monitoring and compliance complexities. Effective observability bridges the gap between research and real-world reliability, ensuring models remain performant, cost-efficient, and secure in dynamic environments.
The world of AI operations is rapidly evolving beyond traditional monitoring approaches. As organizations deploy LLMs at scale, they face unique challenges: unpredictable inference costs, model drift detection, security compliance, and the need for real-time performance insights. This comprehensive guide explores the essential observability strategies and tools needed to successfully monitor LLMs in production.
Why Does Observability Matter for LLMs?
LLMs operate on massive datasets, require high-performance compute/storage, and serve unpredictable user loads. Traditional monitoring tools fall short—comprehensive observability is essential for:
- Preventing unexpected downtime and performance bottlenecks
- Tracking model drift, accuracy, and prompt performance
- Enforcing security, privacy, and compliance for sensitive data
- Controlling costs and scaling efficiently
Unlike traditional applications, LLMs present unique observability challenges including token-based pricing models, variable inference times, and the need to monitor both technical metrics and model quality metrics.
Key Observability Pillars
Metrics Collection & Telemetry
Capture request latency, throughput, prompt complexity, GPU/memory utilization, token counts, and user feedback. Use Prometheus and OpenTelemetry for collection, with Grafana for dashboards.
Distributed Tracing
LLMs typically run as microservices (often gRPC/REST APIs). Distributed traces pinpoint bottlenecks and enable root cause analysis. OpenTelemetry Auto Instrumentation streamlines tracing integration.
Health Checks & Canary Deployments
Use proactive, Kubernetes-native health checks (Canary Checker) to validate output quality for every new LLM build. Automate rollback and staged rollouts based on observability signals.
Security & Compliance Monitoring
LLM pipelines should support encryption, secure logging, and integrate policy-as-code tools (Kyverno). Runtime monitoring (with Tetragon, Cilium Hubble) addresses in-memory threats and zero trust.
Usage, Drift, and Cost Tracking
Monitor resource/hardware usage and track model drift with vector databases and open-source logging tools (Loki, ELK). Implement usage-based billing for accurate cost attribution.
LLM Observability Tools & Platforms
The ecosystem for LLM observability continues to grow, with several powerful commercial and open source solutions:
| Tool | Type | Key Features | Pricing/Freemium | Pros | Cons | Self-host Option |
|---|---|---|---|---|---|---|
| LangSmith | Paid | LLM tracing, cost analytics, feedback, works natively with Langchain | Free tier up to 5,000 traces/month; paid SaaS tiers available; self-hosting only in enterprise | Robust integration with Langchain, manual/auto evals, SaaS simplicity | No open source backend, self-host for enterprise only, vendor lock-in risk | Limited (Enterprise) |
| Lunary | Free/Open Src | Model tracking, categorization (Radar), prompt analytics | Free up to 1,000 events/day; open source under Apache 2.0 | Completely open source, can self-host for privacy, easy integration | Event limit on free cloud, limited advanced analytics compared to commercial | Yes |
| Phoenix (Arize) | Free/Open Src | Tracing, evaluation, hallucination detection | Free (ELv2 license), no full hosted SaaS; paid AX Pro starts at $50/m | Works out-of-box with LlamaIndex/LangChain/OpenAI, OTel compatible, built-in evals | Paid plan for hosted, may require infra management for self-host | Yes |
| Langfuse | Free/Open Src | Session tracking, tracing, evaluation, OpenTelemetry backend | Free self-host up to 50k events/mo; $59/m for 100k events (managed), $199/mo Pro | Most complete OSS feature set, SOC2 compliant, wide integrations | Hosted plans have data limits, advanced features priced | Yes |
| Helicone | Paid & OSS | LLM monitoring, prompt management, caching, cost tracker | Free up to 10,000 requests; $20/m Pro, $200/m Team | Caching reduces API costs, SDK and proxy integration, security features | Limited requests in free; higher tiers unlock retention/features | Yes |
| Grafana Cloud | Paid/Open Src | Visualization, dashboards, multi-source metrics/logs/traces | Free up to 100GB data (3 active users); Pro $19/user/mo; Enterprise $8/user/mo | Flexible, massive plugin ecosystem, custom dashboards, active community | Usage tiers can get expensive, learning curve for advanced use | Yes |
| Traceloop OpenLLMetry | Free/Open Src | OTel style tracing, multi-tool compatibility | Free, open source (Apache 2.0), backend also free | Universal OTel-compatible, integrates with Langchain, LlamaIndex | Infra setup required, less advanced analytics | Yes |
Recent surveys highlight these platforms' support for token counting, semantic traceability, drift detection, and GPU observation.
Hands-On Demo: Langfuse in Action
To demonstrate LLM observability in practice, let's walk through a complete setup using Langfuse—one of the most comprehensive open-source solutions. This demo showcases real-world tracing, session management, and analytics for LLM applications.
Setting Up Langfuse Cloud
Langfuse offers both self-hosted and cloud options. For this demo, we'll use the cloud version for rapid setup:
- Create Account: Visit cloud.langfuse.com and sign up for a free account
- Get API Keys: Navigate to Settings → API Keys and copy your Public Key and Secret Key
- Configure Environment: Set up your environment variables:
LANGFUSE_PUBLIC_KEY=pk-lf-your-key-here
LANGFUSE_SECRET_KEY=sk-lf-your-key-here
LANGFUSE_HOST=https://cloud.langfuse.com
OPENAI_API_KEY=your-openai-api-key-here
bash
Demo Applications
We've created three comprehensive demo scenarios that showcase different aspects of LLM observability:
1. Simple Chat Interface
A basic conversational AI that demonstrates fundamental tracing concepts:
from langfuse import Langfuse
import openai

langfuse = Langfuse(
    public_key="your-public-key",
    secret_key="your-secret-key",
    host="https://cloud.langfuse.com"
)

def chat_with_llm(user_message: str, model: str = "gpt-3.5-turbo") -> str:
    # Start a span for this chat completion
    span = langfuse.start_span(name="chat_completion", input=user_message)
    try:
        # Start a generation observation
        generation = langfuse.start_observation(
            name="llm_call",
            model=model,
            input=user_message,
            as_type="generation"
        )

        response = openai.chat.completions.create(
            model=model,
            messages=[
                {"role": "system", "content": "You are a helpful AI assistant."},
                {"role": "user", "content": user_message}
            ],
            temperature=0.7,
            max_tokens=500
        )

        result = response.choices[0].message.content
        generation.update(output=result)
        generation.end()
        span.update(output=result)
        span.end()

        return result
    except Exception as e:
        error_msg = f"Sorry, I encountered an error: {str(e)}"
        generation.update(output=error_msg, level="ERROR")
        generation.end()
        span.update(output=error_msg, level="ERROR")
        span.end()
        return error_msg
python
2. RAG (Retrieval Augmented Generation) Pipeline
A more complex workflow showing document retrieval, context assembly, and generation:
def rag_pipeline(query: str) -> Dict[str, any]:
    # Start main span for RAG pipeline
    trace = langfuse.start_span(name="rag_pipeline", input=query)

    try:
        # Step 1: Retrieve relevant documents
        documents = retrieve_relevant_documents(query, trace=trace)

        # Step 2: Assemble context
        context = assemble_context(documents, query, trace=trace)

        # Step 3: Generate answer
        answer = generate_answer(context, trace=trace)

        result = {
            "query": query,
            "retrieved_documents": documents,
            "context": context,
            "answer": answer
        }

        trace.update(name="rag_pipeline", output=result, metadata={"doc_count": len(documents)})
        return result
    finally:
        trace.end()
python
3. Multi-Step Workflow
Demonstrates complex conversation chains and problem-solving workflows with nested spans and observations.
Langfuse Dashboard Overview
Once you run the demo applications, the Langfuse dashboard provides comprehensive insights into your LLM operations:
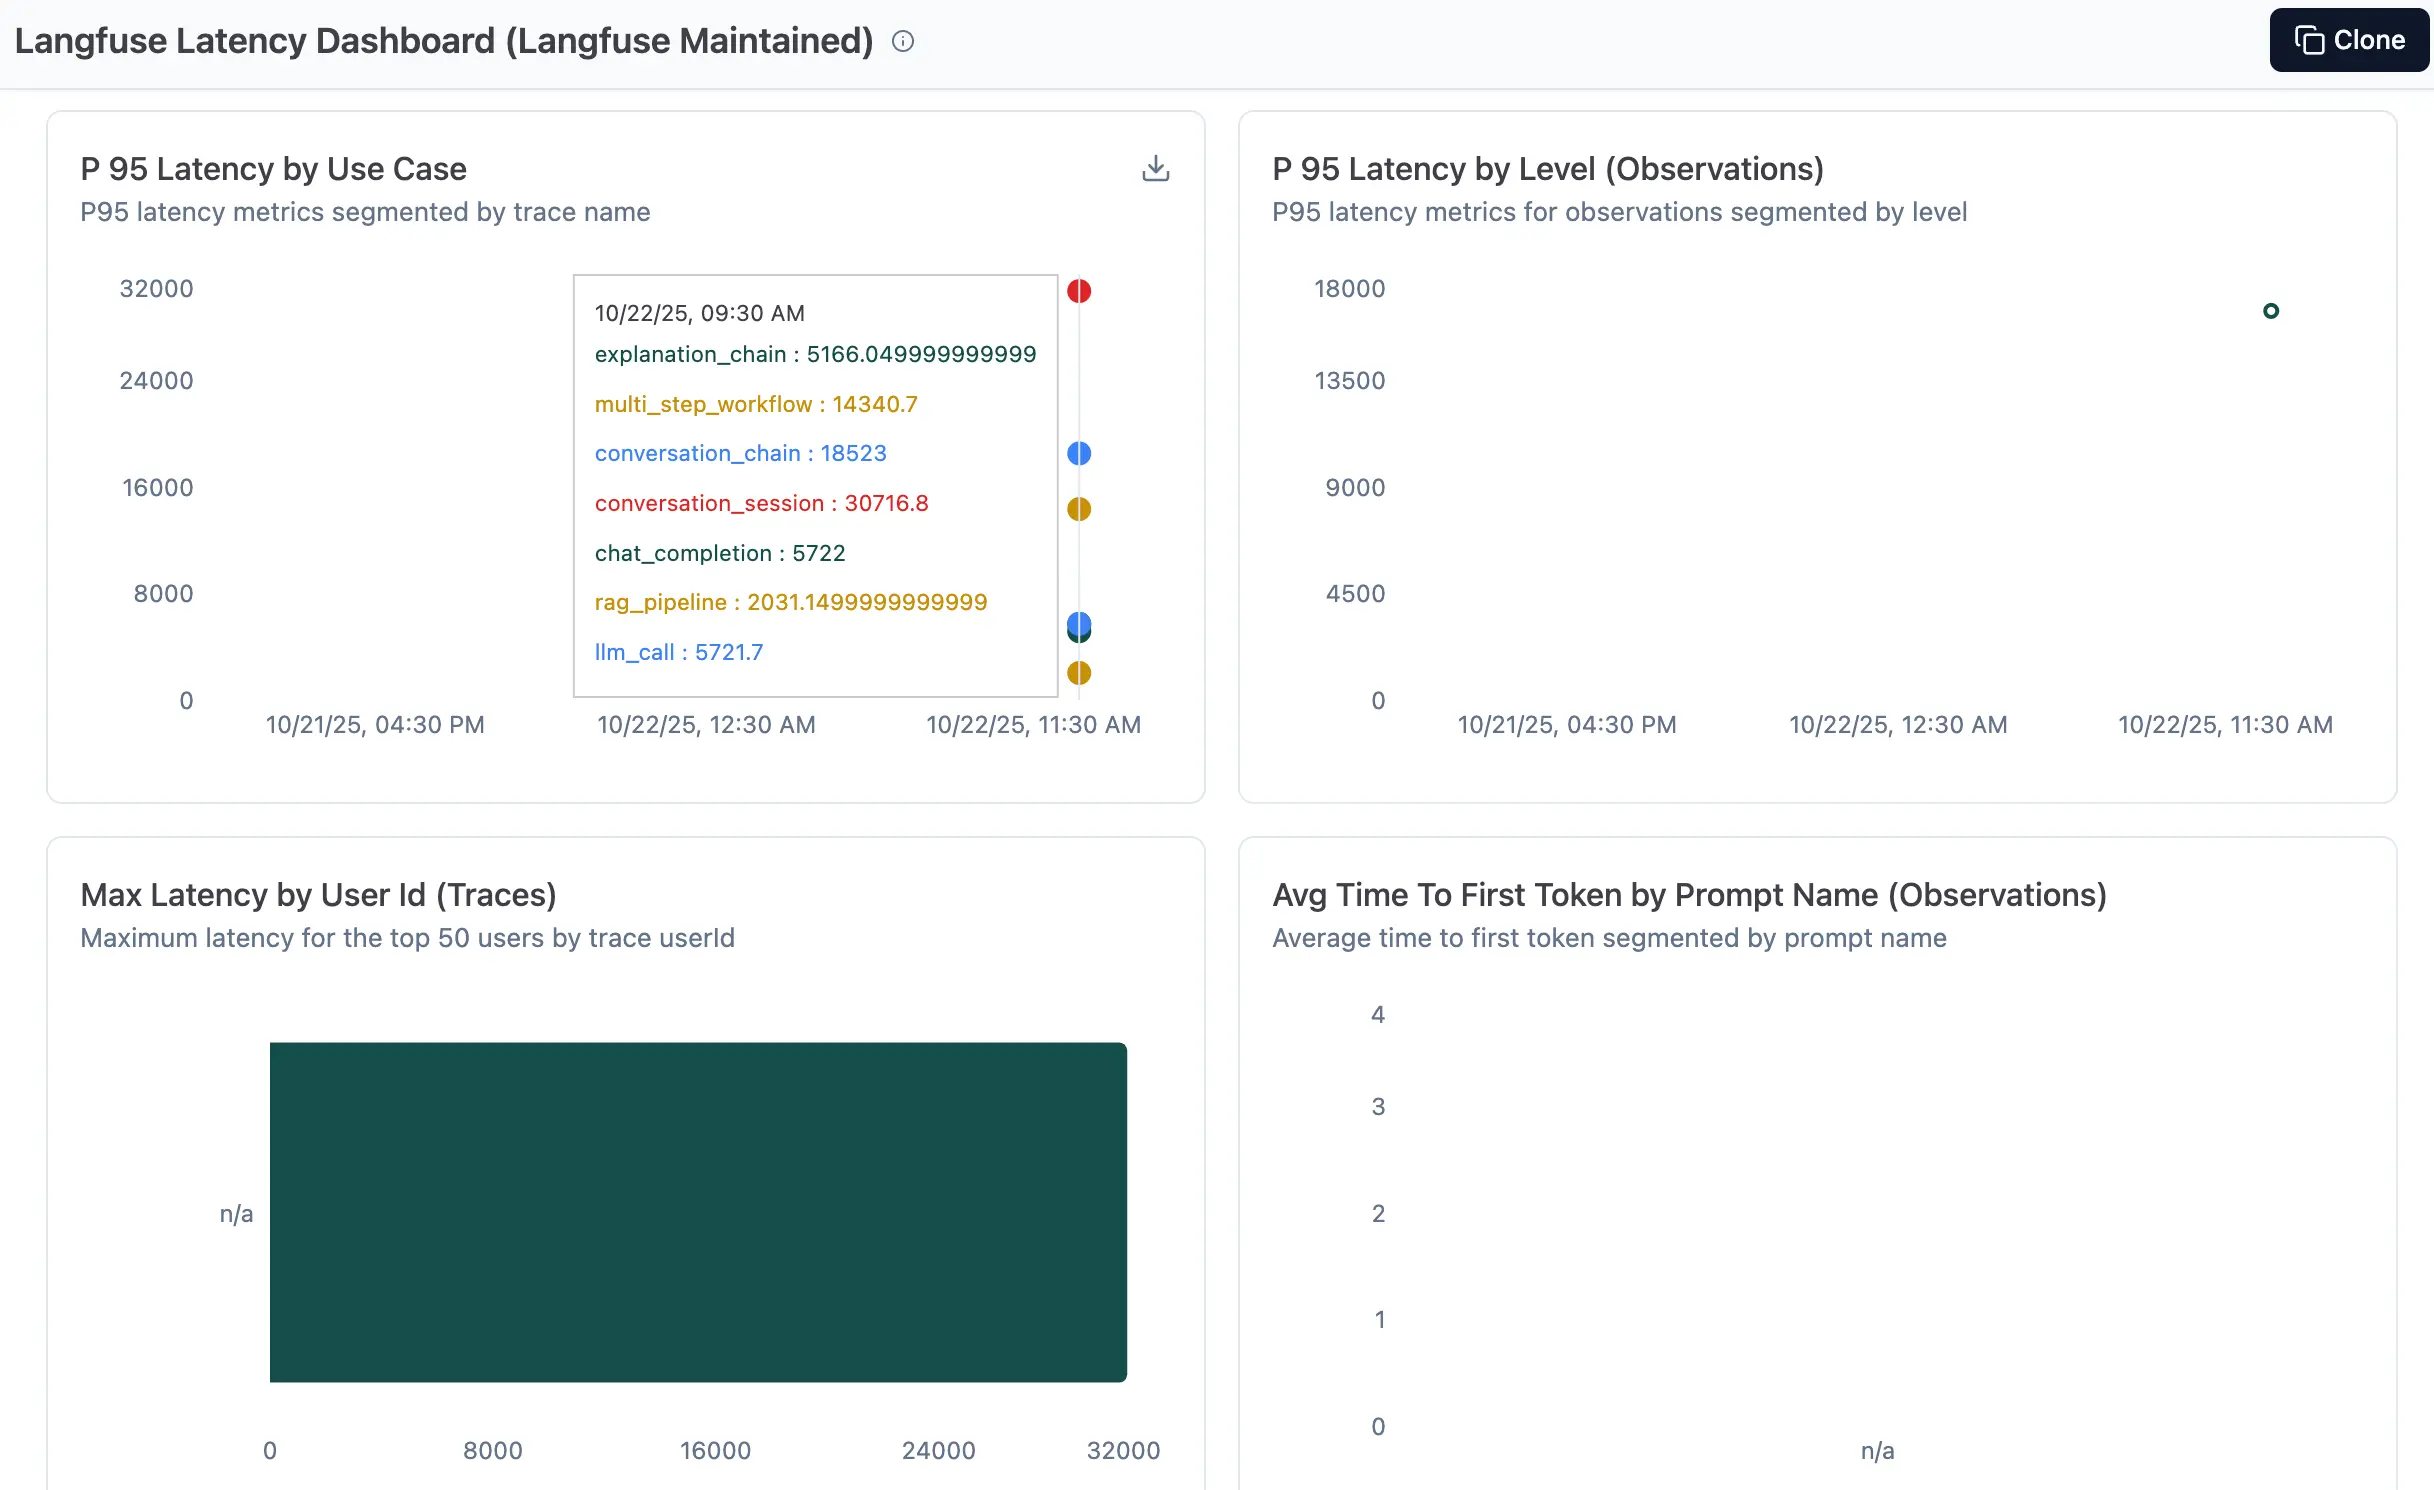 Langfuse dashboard showing latency metrics and performance insights from our demo applications
Trace Detail View
Individual traces reveal the complete request flow with nested spans, timing breakdown, and token usage:
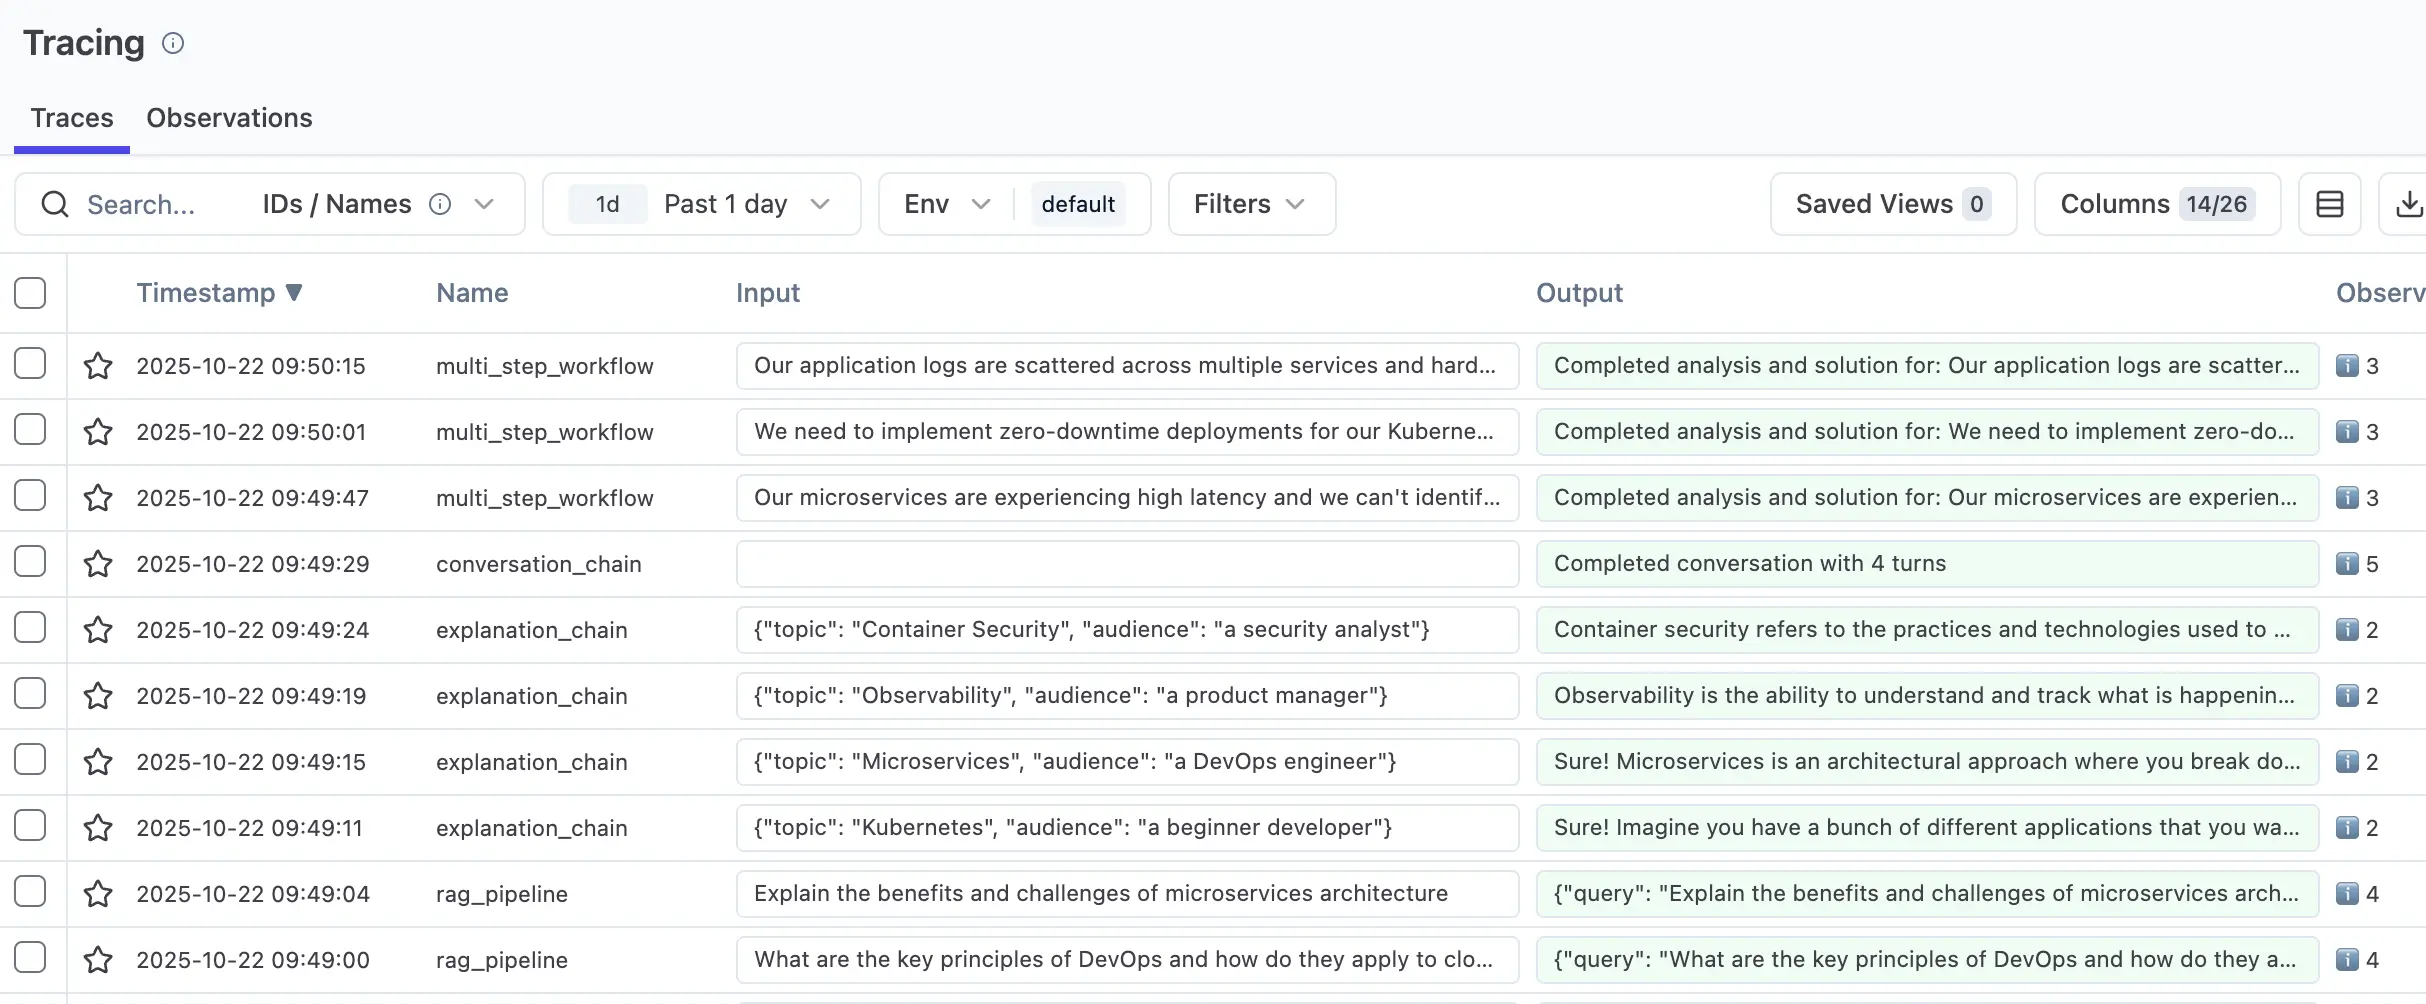 Detailed trace view showing nested spans for RAG pipeline: document retrieval → context assembly → LLM generation
Analytics and Cost Tracking
Built-in analytics track token usage, costs, and performance over time:
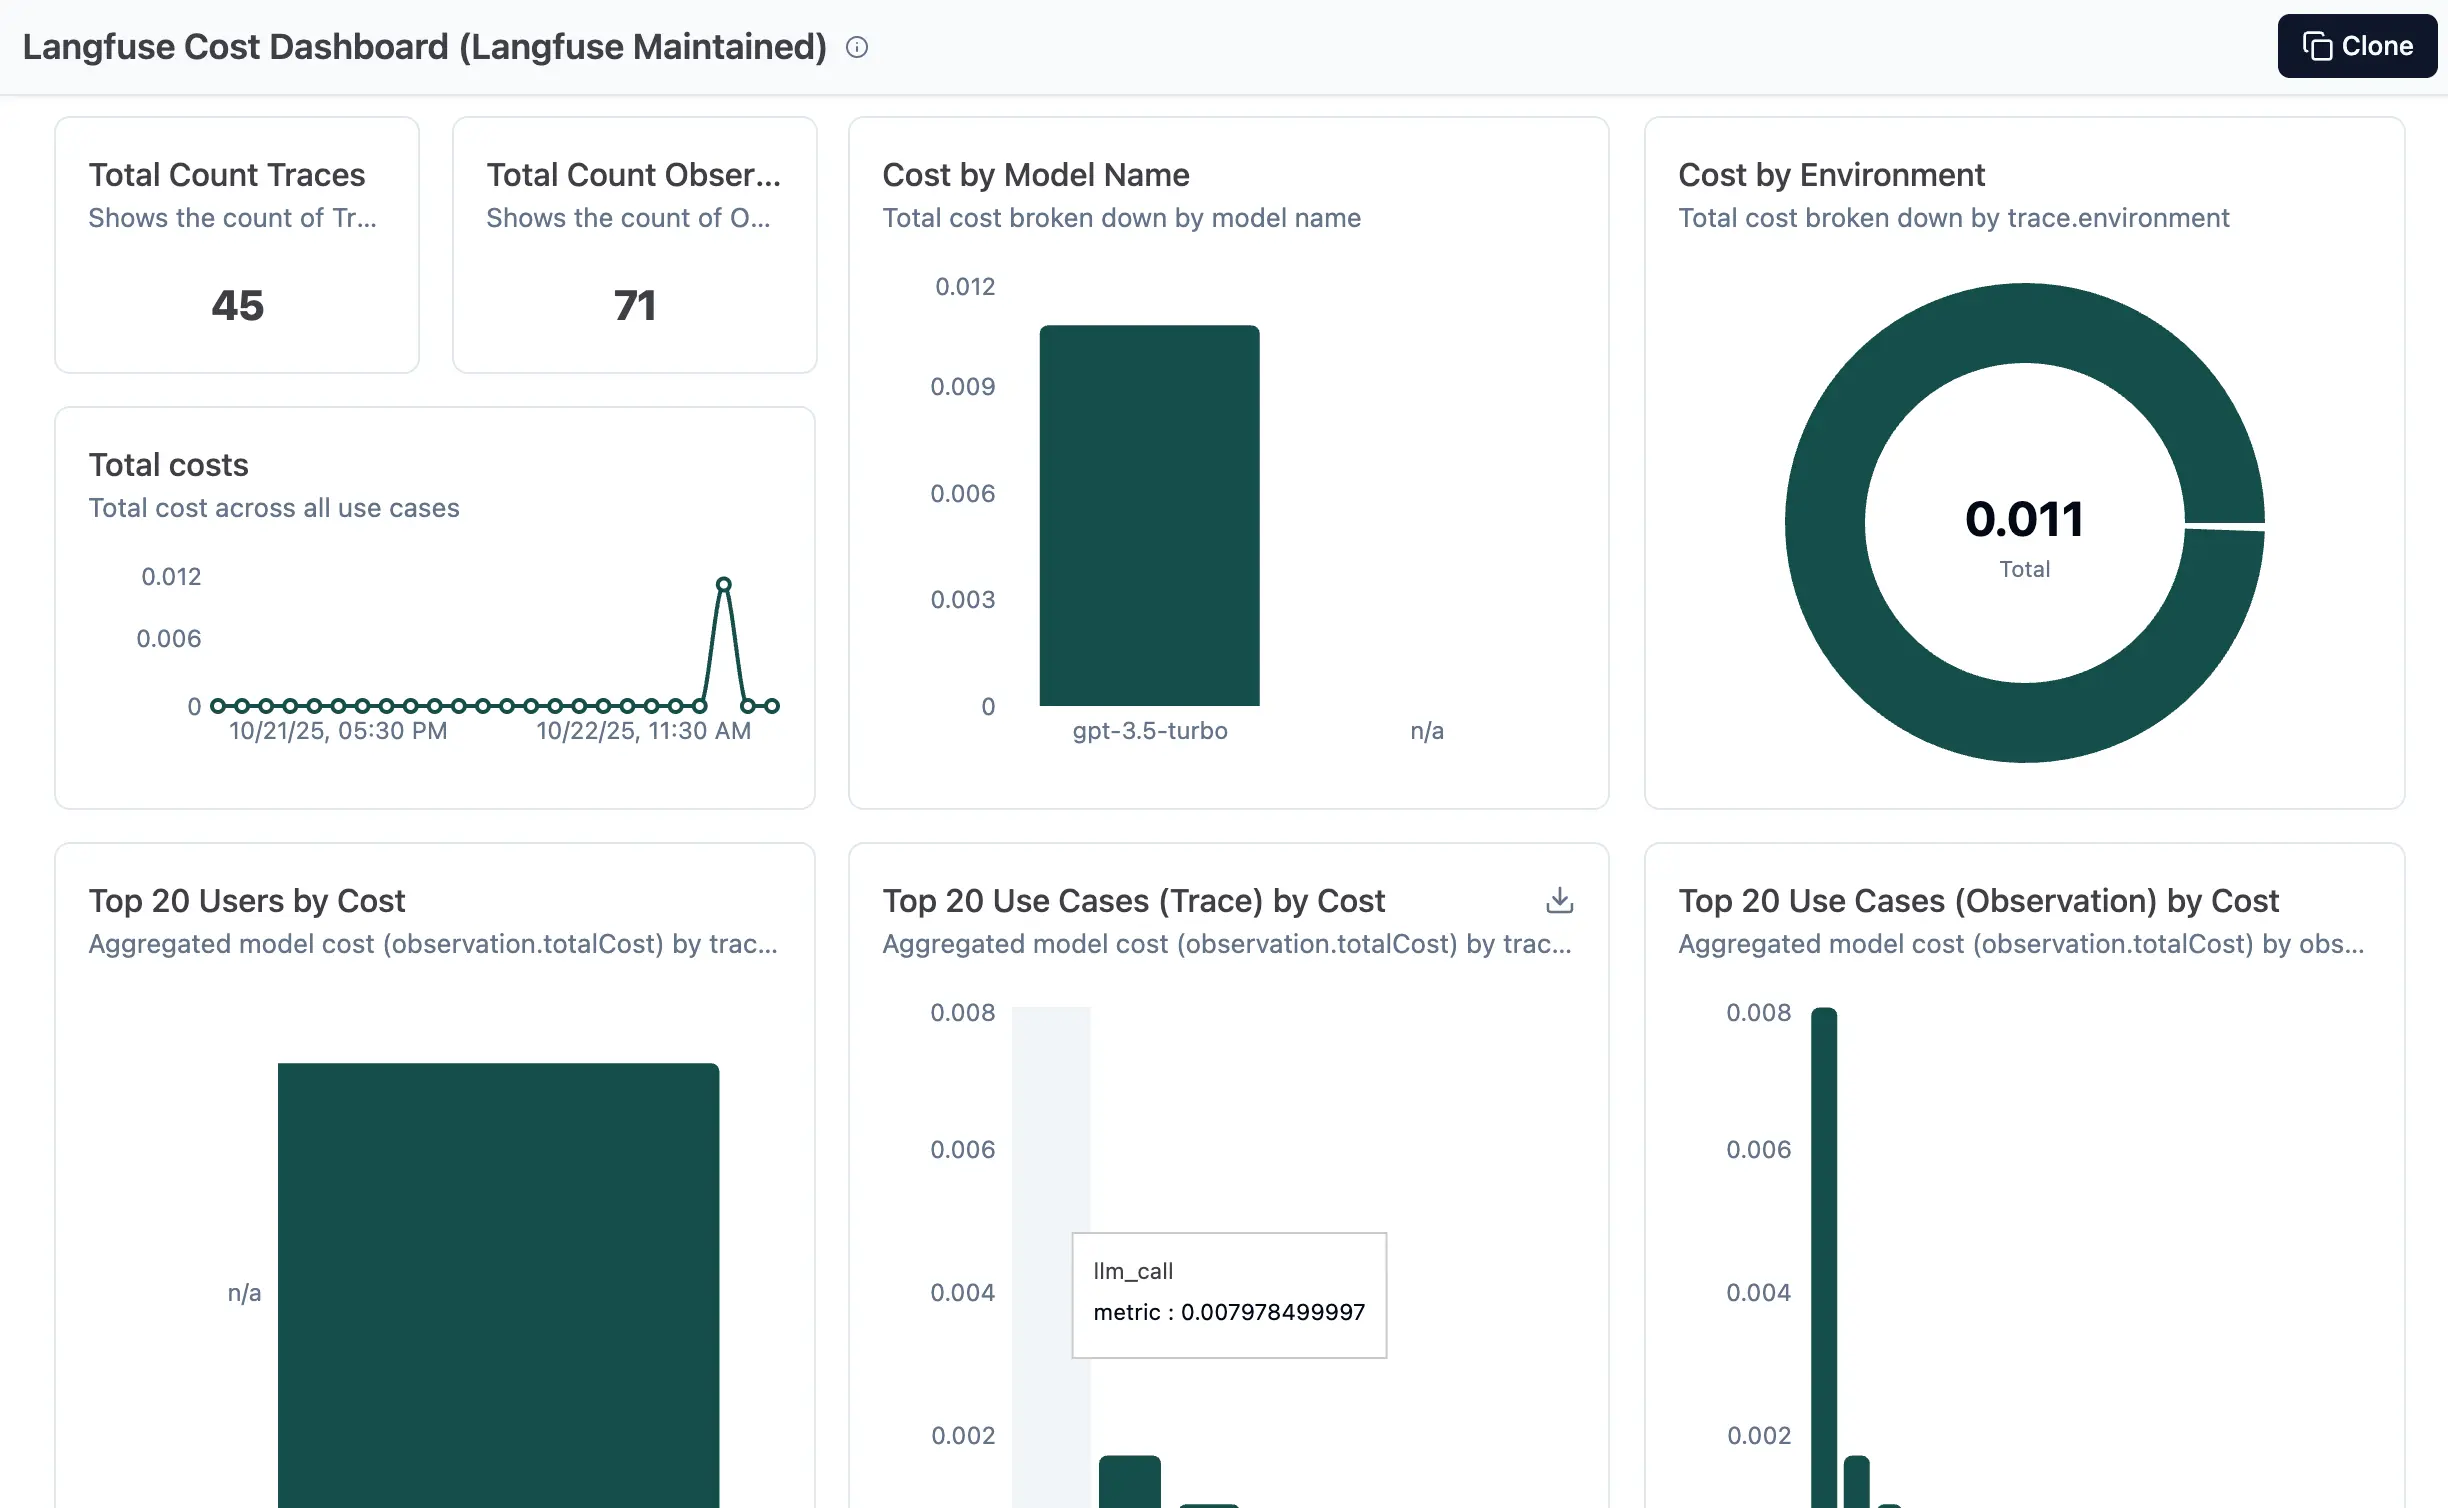 Analytics dashboard displaying token usage, cost analysis, and performance metrics across different models
Key Benefits Demonstrated
This hands-on demo showcases several critical LLM observability capabilities:
- Distributed Tracing: Complete visibility into multi-step LLM workflows
- Performance Monitoring: Real-time latency, throughput, and error tracking
- Cost Management: Token usage and cost attribution across different models
- Error Handling: Comprehensive error tracking and debugging information
Running the Demo
To try this demo yourself:
# Clone the demo repository
git clone https://github.com/cloudraftio/langfuse-demo.git
cd langfuse-demo

# Install dependencies
pip install -r requirements.txt

# Configure environment
cp env.example .env
# Edit .env with your API keys

# Run all demos
python run_all_demos.py
bash
The demo generates realistic traces across different scenarios, providing a comprehensive view of LLM observability in action.
Implementation Guide: LLM Monitoring on Kubernetes
Deploying and observing LLMs in Kubernetes requires integrating metrics collection, tracing, logging, alerting, security, and visualization. Below is a detailed how-to guide with working code snippets and configurations:
1. Exporting LLM Metrics with Prometheus
Expose inference request counts and latency metrics from your LLM service. Here's a minimal FastAPI example with Prometheus integration:
from fastapi import FastAPI, Request
from prometheus_client import Counter, Histogram, make_asgi_app
import time

app = FastAPI()

REQUEST_COUNT = Counter("llm_requests", "Number of LLM requests")
REQUEST_LATENCY = Histogram("llm_request_latency_seconds", "Request latency in seconds")

@app.post("/generate")
async def generate(req: Request):
    start = time.time()
    data = await req.json()
    # Simulate call to LLM model
    response = {"output": "Example LLM output"}
    REQUEST_COUNT.inc()
    REQUEST_LATENCY.observe(time.time() - start)
    return response

# Serve metrics at /metrics for Prometheus scraping
app.mount("/metrics", make_asgi_app())
python
Key takeaways:
- Metrics include request count and request latency
- Prometheus scrapes /metrics endpoint automatically
2. Adding Distributed Tracing with OpenTelemetry
Enable transparent tracing of requests through auto instrumentation:
from fastapi import FastAPI
from opentelemetry.instrumentation.fastapi import FastAPIInstrumentor
from opentelemetry.sdk.resources import Resource
from opentelemetry.sdk.trace import TracerProvider
from opentelemetry.exporter.jaeger.thrift import JaegerExporter
from opentelemetry.sdk.trace.export import BatchSpanProcessor

app = FastAPI()

# Configure tracer provider
trace_provider = TracerProvider(resource=Resource.create({"service.name": "llm-service"}))
jaeger_exporter = JaegerExporter(
    agent_host_name="localhost",
    agent_port=6831,
)
trace_provider.add_span_processor(BatchSpanProcessor(jaeger_exporter))

# Set tracer provider globally
from opentelemetry import trace
trace.set_tracer_provider(trace_provider)

# Instrument FastAPI app
FastAPIInstrumentor.instrument_app(app)
python
Notes:
- Sends traces to Jaeger (could be any other tracer backend)
- Captures detailed performance and call path info
3. Defining Prometheus Alert Rules for Latency
Alert on unusually high LLM response latency to proactively catch slowed inference:
apiVersion: monitoring.coreos.com/v1
kind: PrometheusRule
metadata:
  name: llm-alerts
spec:
  groups:
    - name: llm.rules
      rules:
        - alert: HighLLMLatency
          expr: histogram_quantile(0.95, sum(rate(llm_request_latency_seconds_bucket[5m])) by (le)) > 2
          for: 5m
          labels:
            severity: warning
          annotations:
            summary: 'LLM inference latency at 95th percentile is greater than 2 seconds'
yaml
4. Centralized Log Aggregation
Use Fluentd or Promtail to ship container logs to Loki for easy search and parsing. Example Promtail config snippet:
server:
  http_listen_port: 9080
clients:
  - url: http://loki:3100/loki/api/v1/push
scrape_configs:
  - job_name: kubernetes-pods
    pipeline_stages:
      - docker: {}
    kubernetes_sd_configs:
      - role: pod
    relabel_configs:
      - source_labels: [__meta_kubernetes_pod_label_app]
        action: keep
        regex: llm-service
yaml
5. Kubernetes Native Health Checks using Canary Checker
Install and configure Canary Checker to run quality assurance tests on model output before new versions go live:
- Write proactive test scripts for key prompt responses
- Define health check probes that measure model accuracy over test queries
- Automate canary deployments and rollbacks based on health status
6. Security & Compliance Integration
Protect observability data and runtime environments with:
- Kyverno: Policy enforcement for namespaces, secrets, and logs
- Tetragon: eBPF runtime monitoring for suspicious system calls
- Cilium Hubble: Network observability at packet and service granularity
Example Kyverno policy to restrict access to metrics endpoint:
apiVersion: kyverno.io/v1
kind: ClusterPolicy
metadata:
  name: restrict-metrics-access
spec:
  rules:
    - name: block-public-metrics
      match:
        resources:
          kinds:
            - Service
          namespaces:
            - default
      validate:
        message: 'Metrics service must not be publicly accessible.'
        pattern:
          spec:
            type: ClusterIP
yaml
7. Visualization with Grafana
Connect Grafana to Prometheus, Loki, and Jaeger:
- Create dashboards to display request latency trends, error rates, and token usage per inference
- Use traced request flows to drill into problematic LLM interactions
- Set alerts in Grafana for SLA breaches
What LLM Observability Can't Do
While powerful, LLM observability has limitations:
- Model Quality Assessment: Observability tools can detect performance issues but cannot automatically assess the quality or accuracy of model outputs
- Context-Aware Monitoring: Understanding the semantic meaning of prompts and responses requires specialized AI evaluation tools
- Real-time Model Drift Detection: While tools can track metrics, detecting subtle model drift often requires domain expertise and manual analysis
- Cross-Model Comparison: Comparing performance across different LLM providers or model versions requires custom analysis beyond standard observability tools
In these cases, observability acts as a foundation, providing the data needed for deeper analysis and human expertise.
Need help with LLM observability?
Our team specializes in implementing comprehensive observability solutions for AI workloads. Get expert guidance on monitoring your LLM deployments.
Cost and Limitations
- Open Source Solutions: Free to use but require significant engineering effort for setup, maintenance, and customization
- Commercial Platforms: Provide rapid deployment and advanced features but involve ongoing subscription costs
- Infrastructure Overhead: Running observability tools in Kubernetes requires additional compute and storage resources
- Data Retention: Long-term storage of observability data can become expensive, especially for high-volume LLM applications
- Learning Curve: Effective use of observability tools requires understanding both the tools and LLM-specific monitoring requirements
Conclusion
LLM observability is now a mission-critical capability for any team running generative AI in production—whether on open source frameworks or managed SaaS platforms. Free and open source solutions excel at privacy, flexibility, and customization, enabling technical teams to build tailored monitoring stacks and maintain control over their infrastructure. Paid commercial platforms, meanwhile, shine through rapid onboarding, advanced analytics, enterprise-grade security, managed scaling, and deep integrations with LLM agent ecosystems.
The best choice depends on your organization's scale, budget, compliance needs, and engineering bandwidth. For startups or research environments, open source often offers rapid innovation and complete data sovereignty. For enterprises or mission-critical deployments, commercial observability tools deliver rich feature sets, robust support, and compliance at scale.
Ultimately, combining or layering both approaches—using open source for experimentation and commercial solutions for high-traffic production—can bring organizations the best of both worlds: agility, security, and operational excellence.
If you are looking for a custom AI solution to integrate in your cloud native stack, we can help you build a tailored solution that meets your specific needs. Contact us today to learn more.


