In the rapidly evolving landscape of cloud-native technologies, security remains a paramount concern for organizations of all sizes. As applications become more distributed and complex, traditional security approaches often fail to provide the observability and protection required in modern, dynamic environments.
Enter Tetragon, an innovative open-source security observability, and runtime enforcement tool changing the game in cloud-native security. Tetragon offers unprecedented visibility into system activities and the ability to enforce security policies at runtime.
In this blog post, we'll explore dynamic runtime security in cloud-native environments, a critical approach for protecting today's rapidly evolving containerized applications. We'll examine Tetragon as an example of innovative tooling in this space, showcasing how modern technologies enhance real-time protection in Kubernetes ecosystems.
Understanding eBPF
To fully appreciate Tetragon's capabilities, it's crucial to understand the technology that underpins it: extended Berkeley Packet Filter (eBPF). eBPF is a programming language and runtime that extends the operating system. eBPF is a javascript or lua but for kernel developers.
The Challenge of Comprehensive System Monitoring
Traditionally, creating comprehensive security and observability tools for complex systems has balanced performance and coverage. Imagine trying to monitor every file access across an entire operating system – you'd want to catch any unauthorized attempts to read sensitive data, but checking every single file operation could significantly slow down the system.
Security tools typically had to choose between two suboptimal approaches:
- Run outside the kernel, sacrificing performance and comprehensive visibility.
- Run as part of the kernel, gaining performance but increasing security risks and maintenance complexity.
How eBPF Works
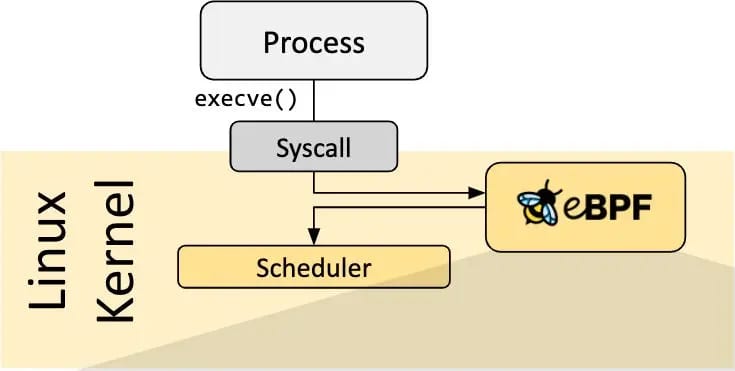
eBPF changes this landscape dramatically. It allows developers to run custom code within the kernel space safely and efficiently, without modifying the kernel source or loading kernel modules.
-
Programmability: Developers write eBPF programs in languages like C, which are then compiled into eBPF bytecode.
-
Safety Verification: Before running, each eBPF program undergoes stringent verification.
-
Just-In-Time Compilation: Once verified, the eBPF bytecode is compiled into native machine code for optimal performance.
-
Event-Driven Execution: eBPF programs are attached to specific events in the kernel, such as network packet arrivals, system calls, or function entries/exits. When these events occur, the corresponding eBPF program is executed.
-
Efficient Data Collection: eBPF programs can efficiently collect, filter, and aggregate data directly in the kernel, sending only relevant information to user space.
Why eBPF Matters for Tetragon
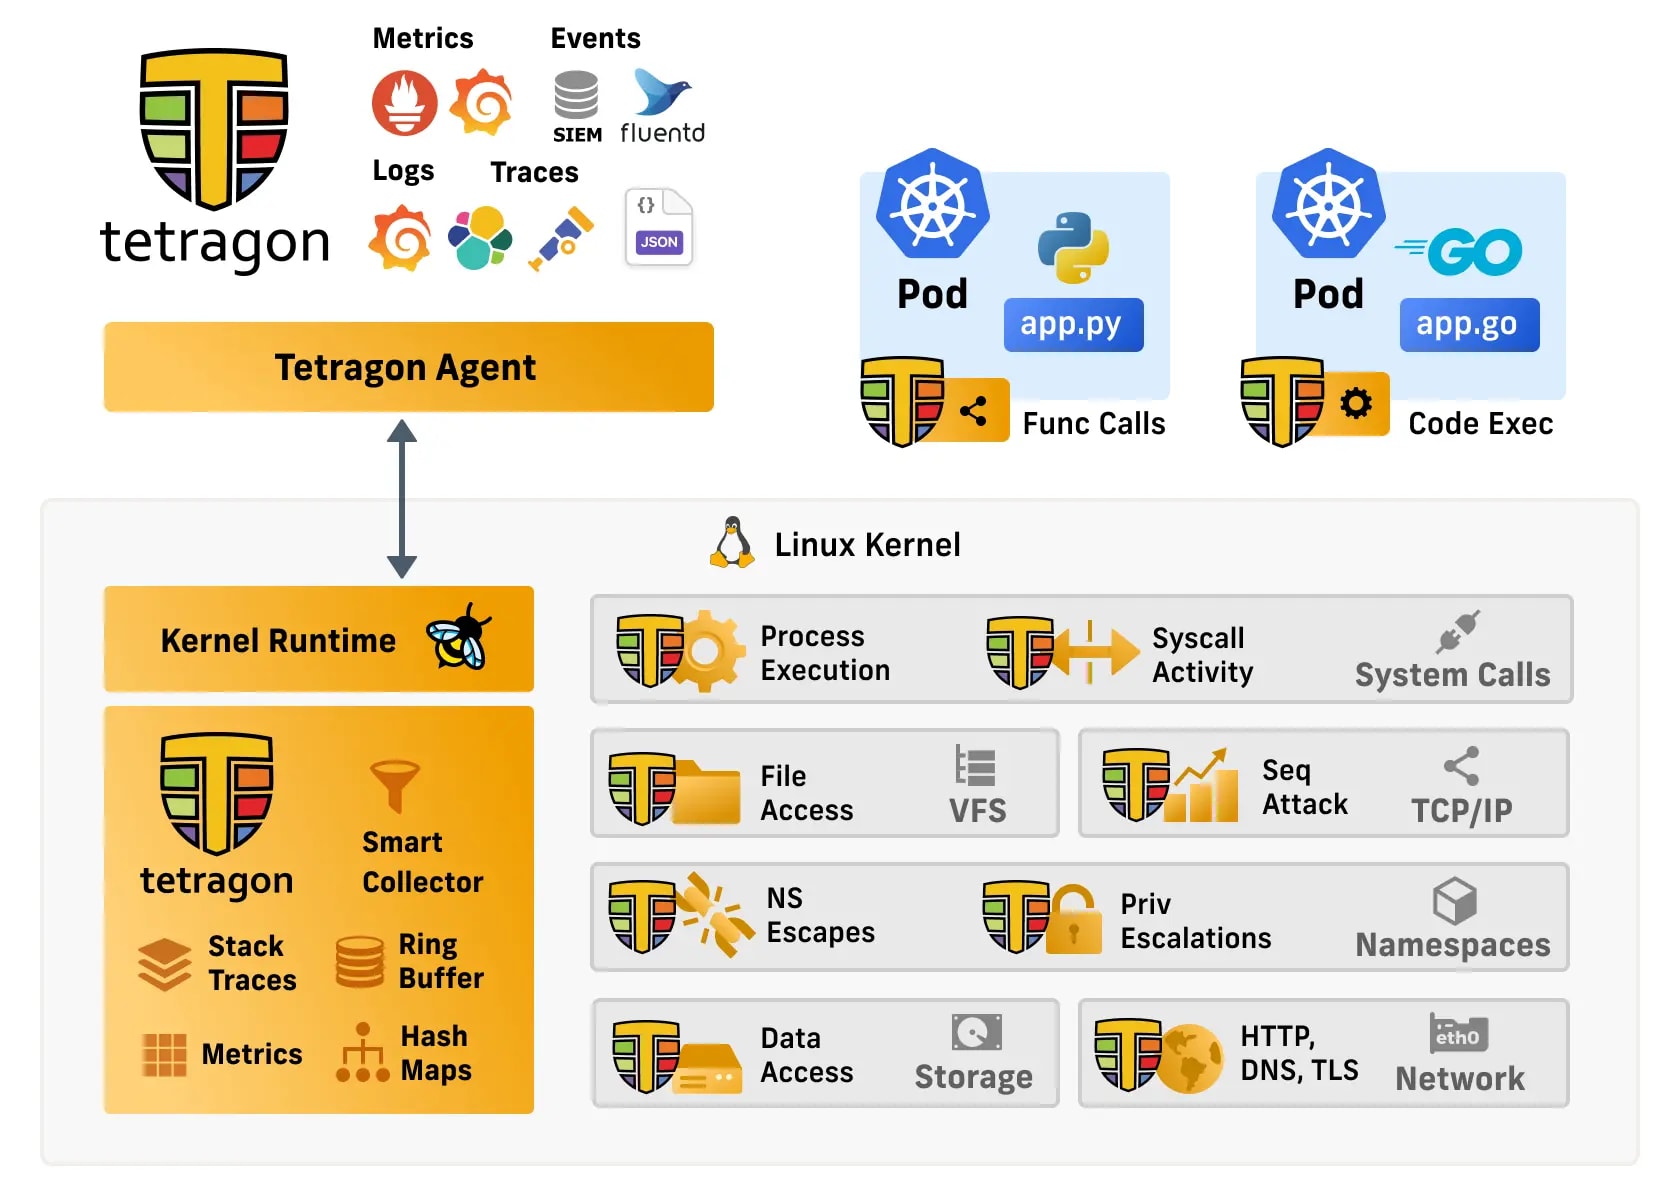
Tetragon leverages eBPF to provide deep, efficient insights into system behavior. It can monitor network connections, track process executions, and enforce security policies, all with minimal performance impact. This allows for unprecedented observability and security capabilities in cloud-native environments, making Tetragon a powerful tool in the modern cybersecurity arsenal.
Tetragon: Revolutionizing Cloud-Native Security with eBPF
What is Tetragon?
Tetragon is an open-source security observability and runtime enforcement tool designed for cloud-native environments. Unlike traditional security tools, Tetragon operates directly within the kernel, allowing it to filter and observe events with minimal overhead. This unique approach enables Tetragon to apply security policies instantaneously, without the need to route information through external agents.
Key Features and Capabilities of Tetragon
Tetragon stands out in the cloud-native security landscape due to its powerful features and capabilities. Let's delve into its core areas where Tetragon excels.
Security Observability
-
Real-time Event Monitoring: Tetragon captures and analyzes system events as they occur, providing immediate insights into potential security issues.
-
Comprehensive Coverage: It monitors a wide range of activities, including process executions, file accesses, and network connections, offering a holistic view of system behavior.
-
Contextual Awareness: Tetragon correlates low-level system events with high-level metadata from Kubernetes, enabling more meaningful and actionable insights.
-
Minimal Performance Impact: By leveraging eBPF, Tetragon achieves deep observability without significant overhead, making it suitable for production environments.
-
Custom Event Filtering: Users can define specific events of interest, allowing for focused monitoring of critical security indicators.
Runtime Enforcement
-
Policy-based Control: Administrators can define and enforce security policies in real-time, directly at the kernel level.
-
Immediate Response: When a policy violation is detected, Tetragon can take immediate action, such as blocking a process or terminating a network connection.
-
Granular Control: Policies can be applied at various levels of granularity, from cluster-wide rules to pod-specific controls.
-
Dynamic Policy Updates: Security policies can be updated and applied on-the-fly, without requiring system restarts or significant downtime.
-
Audit Logging: All policy enforcement actions are logged, providing a clear audit trail for compliance and forensic purposes.
Detailed Telemetry Data Collection
-
High-Fidelity Data: Tetragon captures detailed information about each monitored event, including timestamps, process IDs, user IDs, and more.
-
Kubernetes-aware Telemetry: It enriches system-level data with Kubernetes metadata, providing context-rich information about pod names, namespaces, and labels.
-
Efficient Data Handling: Tetragon processes and filters data at the kernel level, ensuring that only relevant information is propagated, reducing data noise and storage requirements.
-
Flexible Output Formats: Telemetry data can be exported in various formats, making it easy to integrate with existing logging and analytics systems.
-
Historical Analysis: The collected telemetry enables both real-time monitoring and historical analysis, supporting threat hunting and post-incident investigations.
-
Performance Metrics: Beyond security events, Tetragon can collect performance-related telemetry, offering insights into system resource usage and application behavior.
How Tetragon Works and Use Cases for Tetragon
Tetragon uses eBPF for real-time kernel-level monitoring and policy enforcement, crucial for compliance with standards like SOC 2, HIPAA, GDPR, and PCI DSS. Its low-overhead approach provides continuous visibility into system activities, file access, and network connections.
Execution Monitoring
Tetragon tracks all executions in a Kubernetes cluster, virtual machines, and bare metal systems. This foundational capability allows it to attribute system behavior to specific binaries and their associated metadata (container, Pod, Node, and cluster).
File Access Monitoring
Using customizable tracing policies, Tetragon can monitor file access events. These policies use kernel-level filtering to ensure only relevant events are reported, maintaining low overhead even in busy systems.
Network Monitoring
Tetragon provides deep visibility into container and pod communications. This capability is crucial for security analysis and troubleshooting in containerized environments.
Policy Enforcement
Beyond monitoring, Tetragon can enforce security policies in real time. It can restrict certain kernel functions based on predefined rules, enhancing your system's security posture.
Implementing Tetragon on Kubernetes
Tetragon is designed to seamlessly integrate with Kubernetes, running as a DaemonSet to ensure coverage across all nodes in a cluster. This deep integration allows Tetragon to correlate low-level system events with Kubernetes metadata, providing context-rich security insights. The recommended way to deploy Tetragon on a Kuberne
tes cluster is to use the Helm chart with Helm 3.
Install
To install the latest release of the Tetragon helm chart, use the following command.
helm repo add cilium https://helm.cilium.io
helm repo update
helm install tetragon cilium/tetragon -n kube-system
bash
To wait until Tetragon deployment is ready, use the following kubectl command:
kubectl rollout status -n kube-system ds/tetragon -w
bash
Configuration
You can then make modifications to the Tetragon configuration using helm upgrade, see the following example.
helm upgrade tetragon cilium/tetragon -n kube-system --set tetragon.grpc.address=localhost:1337
bash
You can also edit the tetragon-config ConfigMap directly and restart the Tetragon daemonset with:
kubectl edit cm tetragon-config -n kube-system
kubectl rollout restart ds/tetragon -n kube-system
bash
To enable visility into process_credentials, run Tetragon with enable-process-creds setting set.
kubectl edit cm -n kube-system tetragon-config
# Change "enable-process-cred" from "false" to "true", then save and exit
# Restart Tetragon daemonset
kubectl rollout restart -n kube-system ds/tetragon
bash
Deploy demo application
To explore Tetragon it is helpful to have a sample workload. Here we use Cilium’s demo application, but any workload would work equally well:
kubectl create -f https://raw.githubusercontent.com/cilium/cilium/v1.15.3/examples/minikube/http-sw-app.yaml
bash
Verify that all pods are up and running
kubectl get pods
bash
Observe Tetragon execution events
Tetragon exposes the execution events over JSON logs and GRPC stream. The user can then observe all executions in the system. Use the following instructions to observe execution events. These instructions assume you have deployed the Cilium demo application in your environment.
For a single node Kubernetes cluster, you can target the Tetragon DaemonSet with a kubectl exec command:
kubectl exec -ti -n kube-system ds/tetragon -c tetragon -- tetra getevents -o compact --pods xwing
bash
This command runs tetra getevents -o compact --pods xwing in the single Pod that is a member of the Tetragon DaemonSet. Because there is only a single node in the cluster, it is guaranteed that the “xwing” Pod will also be running on the same node and that Tetragon will be able to capture and report execution events.
The tetra get-events -o compact command returns a compact form of the execution events. To trigger an execution event, you will run a curl command inside the “xwing” Pod/container.
kubectl exec -ti xwing -- bash -c 'curl https://ebpf.io/applications/#tetragon'
bash
The CLI will print a compact form of the event to the terminal similar to the following output.
🚀 process default/xwing /bin/bash -c "curl https://ebpf.io/applications/#tetragon"
🚀 process default/xwing /usr/bin/curl https://ebpf.io/applications/#tetragon
💥 exit    default/xwing /usr/bin/curl https://ebpf.io/applications/#tetragon 60
bash
The compact execution event contains the event type, the pod name, the binary and the args. The exit event will include the return code; in the case of the curl command above, the return code was 60.
For the complete execution event in JSON format remove the -o compact option from the tetra getevents command.
kubectl exec -ti -n kube-system ds/tetragon -c tetragon -- tetra getevents --pods xwing
bash
The complete execution event includes a lot more details related to the binary and event.
TracingPolicies: Kubernetes-native Security Rules
Tetragon introduces the concept of TracingPolicies, a custom Kubernetes resource that allows DevSecOps teams to define security policies as code. These policies can match various attributes including:
- System calls
- Process attributes
- Command-line arguments
- Network activity
- File system operations
TracingPolicies make it easy to implement and manage complex security rules across your entire Kubernetes cluster, all while leveraging familiar Kubernetes concepts and workflows.
Real-world Examples in Kubernetes
Let's explore some practical scenarios where Tetragon shines in a Kubernetes environment:
- Detecting Unauthorized Shell Access:
Imagine a scenario where an attacker gains access to one of your application pods and starts a shell. Tetragon can immediately detect this unusual process execution and alert your security team.
apiVersion: cilium.io/v1alpha1
kind: TracingPolicy
metadata:
  name: detect-shell-in-app-pods
spec:
  kprobes:
    - call: 'execve'
      syscall: true
      args:
        - index: 0
          type: string
      selectors:
        - matchBinaries:
            - operator: In
              values:
                - /bin/bash
                - /bin/sh
                - /bin/zsh
                - /usr/bin/bash
                - /usr/bin/sh
                - /usr/bin/zsh
          matchActions:
            - action: Post
              rateLimit: 1m
  podSelector:
    matchLabels:
      app: your-application
yaml- Monitoring the network activity:
In a Microservices architecture, monitoring network activity is crucial for security and performance. Tetragon can help you track and analyze network connections:
apiVersion: cilium.io/v1alpha1
kind: TracingPolicy
metadata:
  name: 'monitor-network'
spec:
  kprobes: # How to inject (kprobes, tracepoints, uprobes)
    - call: 'tcp_connect' # Where to inject (syscall, kernel function, tracepoint)
      syscall: false
      args: # Extra data to include in the event
        - index: 0
          type: 'sock'
      selectors:
        - matchArgs: # How to filter events
            - index: 0
              operator: 'NotDAddr'
              values:
                - 127.0.0.1
      matchActions: # How to react to events (in addition to logging)
        - action: Sigkill
yaml
This policy monitors TCP connections, excluding those to localhost (127.0.0.1). It allows you to track outbound network connections from your pods, which can be useful for detecting unusual network activity or potential security breaches.
Benefits
-
Low Overhead: By leveraging eBPF, Tetragon introduces minimal performance impact, crucial for production Kubernetes clusters.
-
Real-time Enforcement: Policies are enforced in real-time, allowing for immediate response to potential threats.
-
Kubernetes-aware: Tetragon understands Kubernetes concepts, allowing for policies that are pod, namespace, or label-aware.
-
Scalability: As a Kubernetes-native solution, Tetragon scales with your cluster, providing consistent security across your entire infrastructure.
By providing deep, real-time visibility into Kubernetes workloads and the ability to enforce security policies at the kernel level.
Tetragon vs Traditional Security Tools
Tetragon represents a paradigm shift in cloud-native security, offering significant advantages over traditional security tools.
Comparison with Falco
Falco is another prominent open-source cloud-native runtime security project, often used in Kubernetes environments. Let's compare Tetragon and Falco:
| Feature | Tetragon | Falco |
|---|---|---|
| Technology Base | eBPF | Kernel module / eBPF |
| Performance Impact | Very Low | Low to Moderate |
| Kubernetes Integration | Native | Native |
| Rule Language | YAML-based policies | Falco rules (YAML) |
| Event Types | System calls, network events, file access | System calls, network events |
| Real-time Enforcement | Yes | Yes (with Falco Talon) |
| Deployment Complexity | Low (Kubernetes-native) | Low to Moderate |
| Community Support | Growing (part of Cilium project) | Well-established |
| Cloud Provider Support | Broad | Broad |
Key Similarities and Differences
-
Technology Approach: Both leverage eBPF, with Falco also supporting kernel module-based operations.
-
Enforcement Capabilities:
- Tetragon offers built-in real-time policy enforcement.
- Falco, with the recent introduction of Talon, now also provides active response capabilities.
-
Scope of Monitoring: Both tools offer comprehensive monitoring of system calls, network events, and file access, with slight variations in their approach and depth in specific areas.
-
Integration and Ecosystem:
- Tetragon is tightly integrated with the Cilium ecosystem.
- Falco has a wider range of integrations due to its longer presence in the market.
-
Performance and Optimization: Both tools are designed for high-performance, low-overhead operation, with slight variations depending on configuration and use case.
The choice between Tetragon and Falco often depends on specific use cases, existing infrastructure, and integration requirements. Both tools continue to evolve rapidly, addressing the dynamic needs of cloud-native security.
Conclusion
In conclusion, while traditional security tools still have their place, especially in legacy environments, Tetragon represents the cutting edge of cloud-native security. Its ability to provide deep visibility, real-time enforcement, and cloud-native integration with minimal overhead makes it a compelling choice for modern, dynamic infrastructure environments. If you are looking for more help, contact us for guidance.
Enhancing Cloud-Native Security
Our experts can help you bring the best of DevSecOps
