Introduction
In the modern landscape of software development, continuous integration and continuous deployment (CI/CD) are the very heart of DevOps. It enables teams to develop high quality softwares quickly and efficiently. With time, as CI/CD pipelines grow in complexity, so does the need for effective observability to ensure smooth operations, identify bottlenecks and to optimize cost & performance. This is where OpenTelemetry (OTel) comes into play.
In this blog we are going to deep-dive into the importance of having observability for CI/CD and how OpenTelemetry can help us in achieving it.
What is CI/CD?
Continuous Integration and Continuous Deployment, often referred to as CI/CD, is used to make the process of delivering software better and faster. It does this by automating several steps, such as building the software, testing it, and deploying it. CI is about automatically preparing and checking the code changes as soon as they are added and CD is about automatically releasing these changes to the end users.
What is Observability?
Observability refers to the ability to understand the internal state of a system by examining its external outputs. This is usually done by collecting and analyzing data such as logs, metrics, and traces.
Why is observability of CI/CD important?
- Faster issue detection and resolution: With observability teams can quickly identify and detect problems in the pipeline. This reduces downtime and improves overall efficiency.
- Compliance and auditing: Observability provides a clear trail of actions and changes, which is important for regulatory compliance and security audits.
- Performance Optimization: By observing the performance of different stages in the CI/CD pipeline, teams can identify areas for improvement. This can help in optimizing the pipeline for faster build times and more efficient deployments.
- Better decision-making: Data-driven insights from observability tools can help in better decision making.
- Proactive maintenance: Monitoring trends and patterns can help predict and prevent potential issues before they impact production.
What is OpenTelemetry (Otel)?
OpenTelemetry is a collection of API’s SDK’s and tools that are used to generate, collect and export telemetry data from distributed systems.Telemetry data consists of traces, metrics and logs collected from a distributed system. This data helps understand the behavior and performance of the system.
As a Cloud Native Computing Foundation (CNCF) incubating project, OpenTelemetry was formed through the merger of OpenTracing and OpenCensus projects.
It provides a vendor-neutral approach, to generate and collect the data so it can then be sent to any observability back end for analysis.
According to the Grafana Labs observability survey of 2024 98% of respondents use open source observability tools and 50% of them use OpenTelemetry, making it the fourth most used observability technology after Grafana, Prometheus and Grafana Loki.
OpenTelemetry continues to grow its contributor base and remains the second highest velocity project within CNCF.
Key Components of OpenTelemetry
Instrumentation:
OpenTelemetry provides automatic and manual instrumentation libraries for popular programming languages such as Java, Python, Go, and JavaScript. These libraries enable developers to instrument their code and generate telemetry data without making significant changes to their codebase.
APIs
APIs allow developers to create and manage telemetry data in a consistent and vendor-neutral way. These APIs are language specific so they must match the language in which your code is written.
SDKs
OpenTelemetry provides SDKs for various programming languages that implement and support the OpenTelemetry APIs and help in data gathering, processing and exporting.
Collector
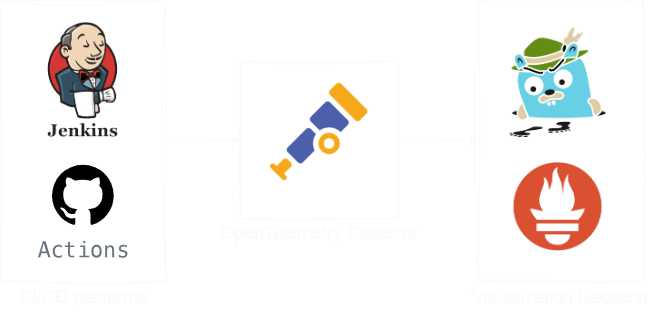
Collector receives, processes, and exports telemetry data to one or more backends. It provides a scalable and extensible architecture that allows developers to easily add new receivers, processors, and exporters to their telemetry pipeline.
Receiver
The receiver defines how data is gathered: either by pushing the data to the Collector during regular intervals or pulling it only when queried. If needed, the receiver can gather data from multiple sources.
Processor
The processor performs intermediary operations that prepare the data for exporting, such as batching and adding metadata.
Exporters
Exporters enable developers to send telemetry data to various backends such as Jaeger, Zipkin, Prometheus, and Elasticsearch. Like the receiver, the exporter can push or pull this data.
The benefits of using OpenTelemetry for CI/CD observability
Using OpenTelemetry for CI/CD observability provides several benefits:
- Vendor-neutral: OpenTelemetry is a vendor-neutral project, which means it is not tied to any specific observability backend. This allows developers to use the observability tools that best fit their needs and easily switch between them without changing their instrumentation code.
- Data flexibility: It allows you to control what telemetry data you send to your platforms. This helps you ensure that you are only capturing the information you need. This is particularly useful in CI/CD pipelines, where data may be generated by multiple tools and services.
- Improved troubleshooting: OpenTelemetry provides a rich set of telemetry data, including traces, metrics, and logs, which can be used to troubleshoot issues in CI/CD pipelines. By having access to detailed telemetry data, developers can quickly identify the root cause of issues and resolve them faster.
- Scalability: OpenTelemetry is designed to be scalable, which means it can handle high volumes of telemetry data generated by CI/CD pipelines. This is particularly important for organizations with large and complex pipelines, where scalability is essential.
- Cost-effective: It is an open-source project, which means it is free to use and does not require any licensing fees. This makes it a cost-effective solution for CI/CD observability, particularly for organizations with limited budgets.
Implementing OpenTelemetry in CI/CD Pipelines
Implementing OpenTelemetry (OTel) in our CI/CD pipeline can significantly enhance observability, allowing us to monitor, troubleshoot, and optimize our processes effectively. Below is a step-by-step guide to help you get started with integrating OpenTelemetry into your CI/CD pipeline.
Setting Up OpenTelemetry in Your CI/CD Pipeline
Prerequisites and Tools
Before you begin, ensure you have the following prerequisites and tools:
- CI/CD Platform: Jenkins, GitLab CI, CircleCI, etc.
- OpenTelemetry Collector: To receive, process, and export telemetry data.
- Observability Backend: Such as Jaeger, Prometheus, or any other backend that supports OpenTelemetry.
Step-by-step guide to implementing OTel in Jenkins
Jenkins is one of the widely popular CI/CD tools and in this guide I’ll explain how we can observe our jenkins cI/CD pipelines using OpenTelemetry and Jaeger.
- Install OpenTelemetry plugin in Jenkins
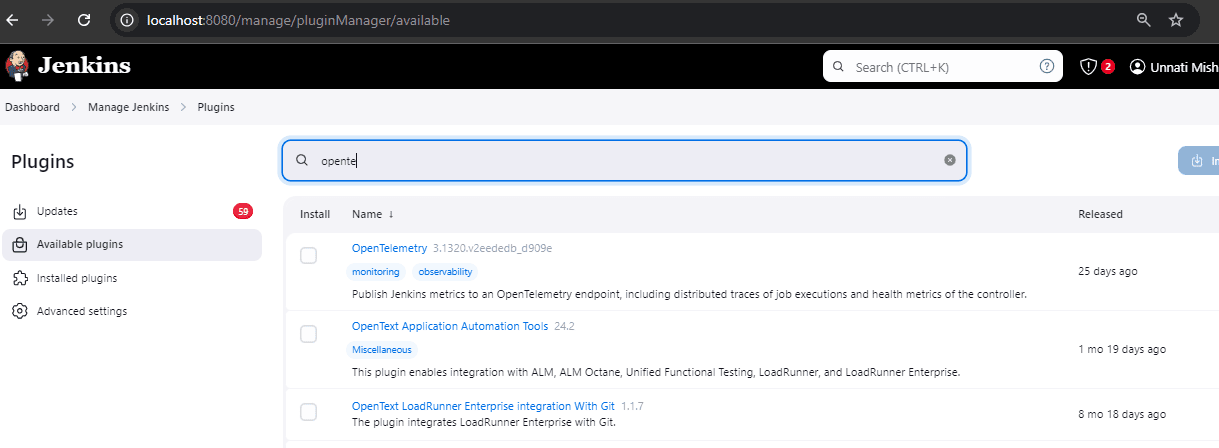
First install the Jenkins OpenTelemetry plugin. For this go to manage jenkins< plugins< available plugin and search for OpenTelemetry. Select the plugin and install it. Restart Jenkins once the plugin is installed.
- Set up the OpenTelemetry collector
- Clone the OpenTelemetry-collector-contrib repo
git clone https://github.com/open-telemetry/opentelemetry-collector-contrib.git
bash- This repo has an examples folder with a demo folder. Run the docker-compose file of the demo application. It already contains configuration for an Otel-collector. This way you don’t have to configure a new otel-collector.
cd opentelemetry-collector-contrib/examples/demo
docker-compose up
bash- Once the docker images are up and running you have to check the port of the OTLP collector that is running on your machine now. For this you can check the list of Docker containers running on your machine.
docker-compose ps
bash- This will give information about all the images created and ports associated with it. Check out the tcp port for the image demo-otel-collector. You will need this port to configure your OTLP endpoint on Jenkins.
- Configure the Jenkins OpenTelemetry plugin
- From your Jenkins dashboard go to manage jenkins. Select systems under system configuration. Since we have installed the OpenTelemetry plugin you can now see an OpenTelemetry configuration option.

- Under the OTLP endpoint provide the endpoint of the demo-otel-collector that you extracted from docker ps. The OTLP endpoint will be
http://<your-ip-address>:<otel-collector-port>
bash
In this case choose the no authentication option.
- You can find your IP address by running the
ipconfigcommand on your cmd. - Add an observability backend for your traces. In this case I am setting up Jaeger as the observability backend.

- With reference to the docker-compose file we are using, your Jaeger instance will ideally be running on port 16686. Set up the Jaeger base URL and save the configuration.
http://<your-ip-address>:16686/
bash- Set up a Jenkins job
- Go to your Jenkins dashboard now and select a new item. Create a new pipeline and observe it on Jaeger now. In this case I selected a multi configuration project and added the link to a simple github golang Hello World repository I created.
- Make sure your repository has a Jenkinsfile. I used a basic Jenkinsfile for this demo.
pipeline {
    agent any

    stages {
        stage('Checkout') {
            steps {
                checkout scm
            }
        }

        stage('Build') {
            steps {
                sh 'go build -o myapp'
            }
        }

        stage('Test') {
            steps {
                sh 'go test ./...'
            }
        }

        stage('Run') {
            steps {
                sh './myapp'
            }
        }
    }
}
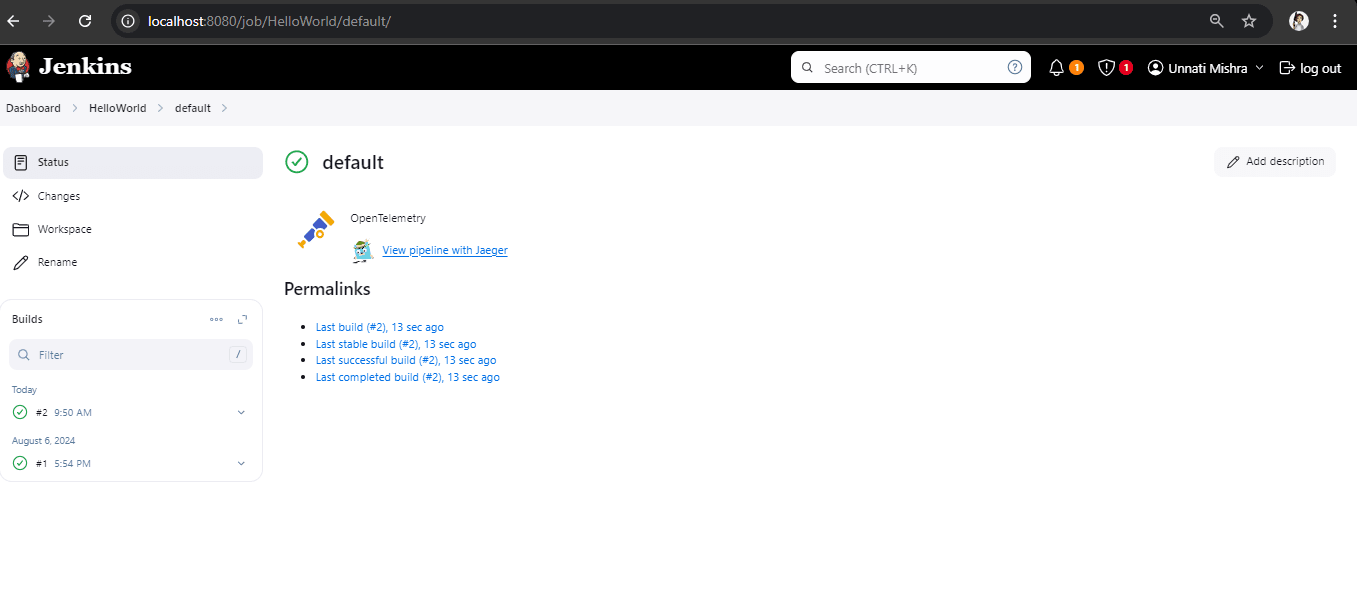
bash- Schedule a build and once it is completed you will get the option to view the pipeline with Jaeger.
- View traces in Jaeger
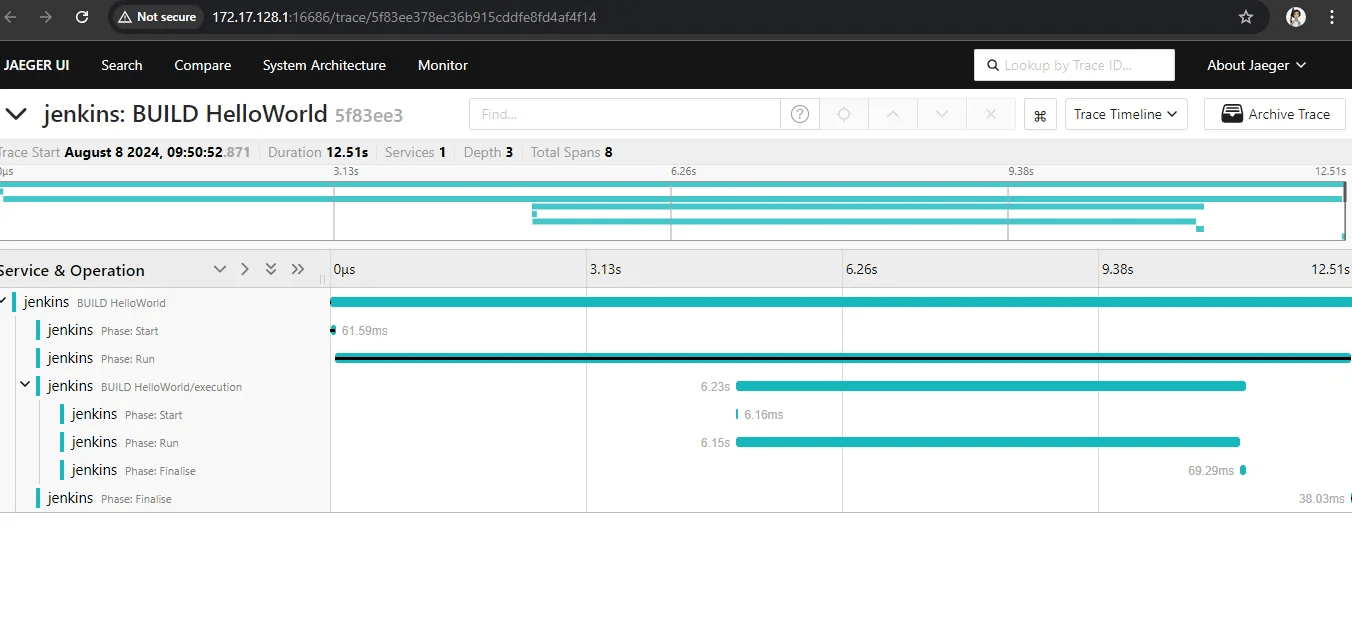
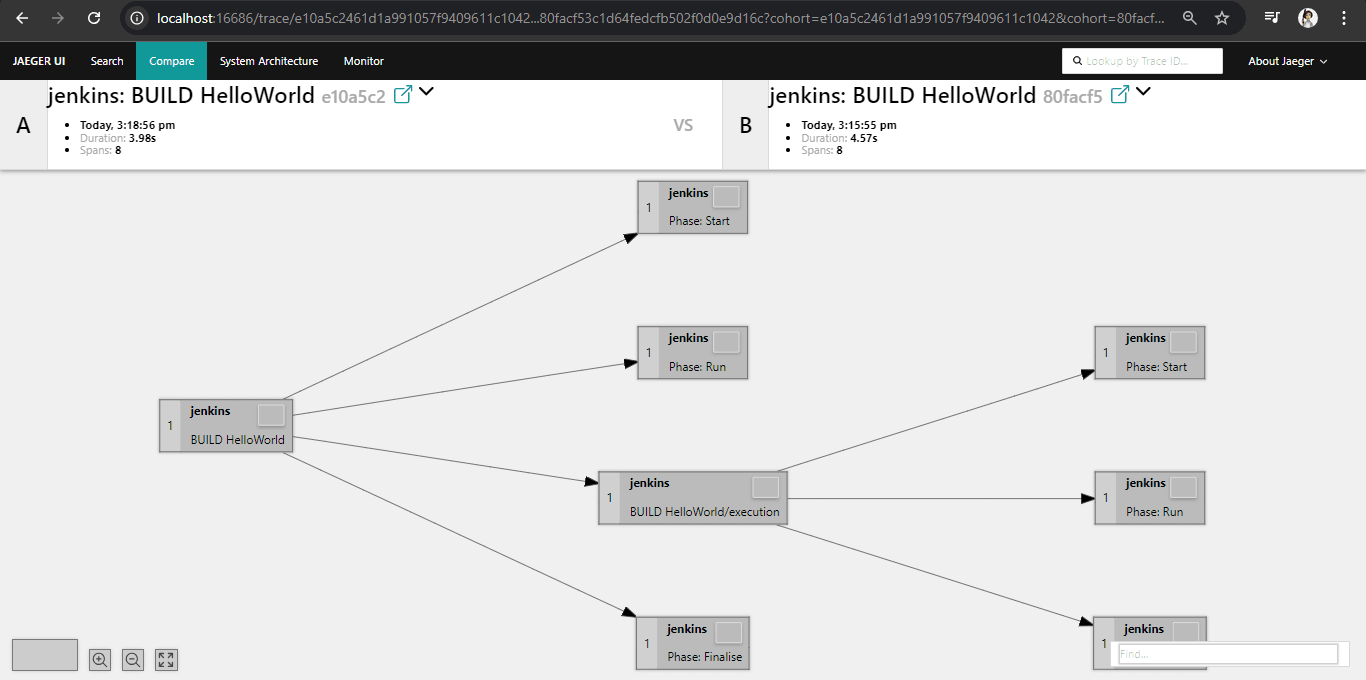
- Click on the view pipeline with Jaeger option and you will be redirected to Jaeger UI where you can see traces of our pipeline. These traces help to understand the total time taken by the pipeline along with the time taken by each and every step.
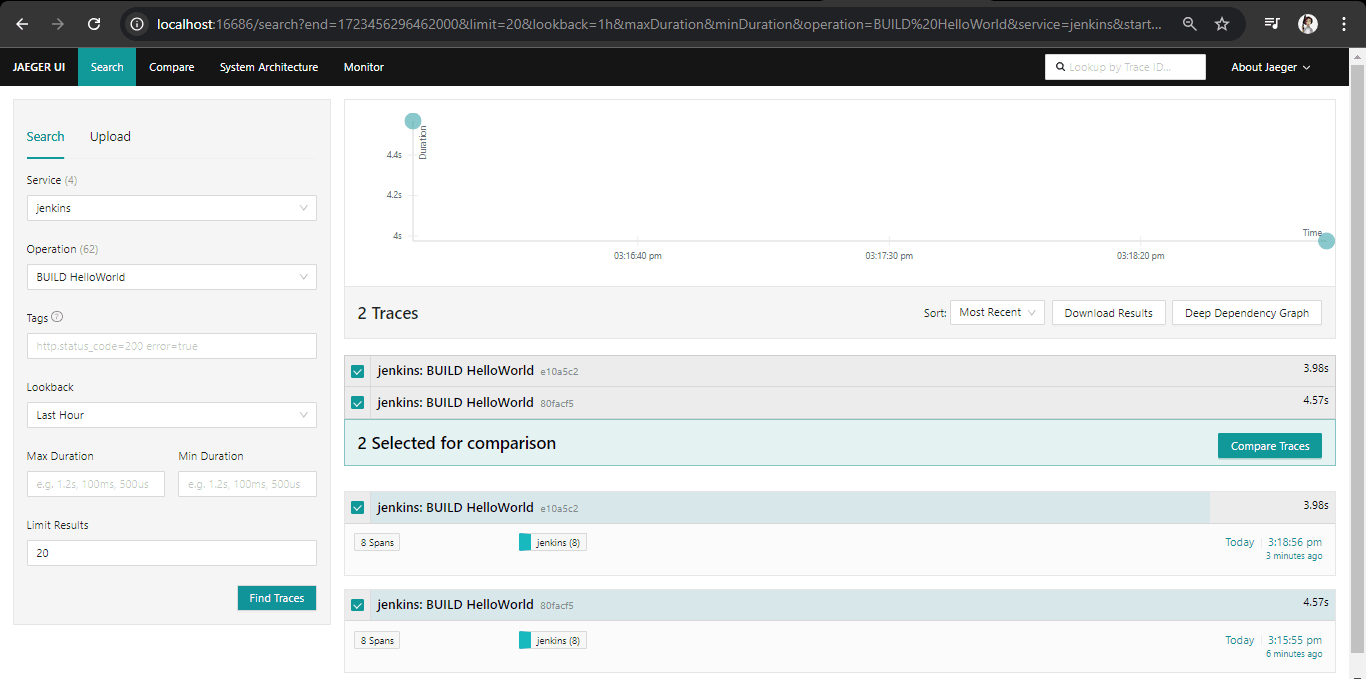
- We can also compare the traces of multiple builds on Jaeger as well.
Common pitfalls and how to avoid them
Incorrect OTLP Endpoint Configuration:
- Pitfall: Mistyping the IP address or port of the OpenTelemetry Collector.
- Solution: Double-check your Docker container ports and use
ipconfigto verify your IP address.
Forgetting to Restart Jenkins:
- Pitfall: Changes not taking effect after plugin installation.
- Solution: Always restart Jenkins after installing new plugins.
Missing Jenkinsfile:
- Pitfall: Pipeline not running as expected.
- Solution: Always include a Jenkinsfile in your repository root.
Misconfigured Observability Backend:
- Pitfall: Unable to view traces in Jaeger.
- Solution: Ensure the Jaeger base URL is correct, typically
http://<your-ip-address>:16686/.
Analyzing OpenTelemetry Data from Pipelines
Once you have successfully integrated OpenTelemetry into your CI/CD pipeline, the next crucial step is to analyze the telemetry data we collected. This data can provide valuable insights into the performance and health of our pipeline.
Key Metrics and Traces to Monitor
- Pipeline Execution Time: Monitor the total time taken by the pipeline to complete. This can help identify any delays or bottlenecks.
- Stage-specific Metrics: Track the time taken by individual stages such as build, test, and deploy. This granularity helps in pinpointing which stage is causing delays.
- Error Rates: Keep an eye on the number of errors and failures at each stage. High error rates can indicate issues with the code or the pipeline configuration.
- Resource Utilization: Monitor CPU, memory, and disk usage during pipeline execution. High resource utilization can indicate inefficiencies that need to be addressed.
- Trace Analysis: Use traces to understand the sequence of events and dependencies between different stages. This can help in identifying where the pipeline is spending the most time.
Best Practices for Using OpenTelemetry in CI/CD
Here are some best practices for using OpenTelemetry in CI/CD pipelines:
- Instrument Early and Often: Instrumenting code early in the development process can help identify performance issues and other problems before they become more significant issues.
- Automatic Instrumentation: Automatic instrumentation can save time and reduce the effort required to instrument code manually. OpenTelemetry provides automatic instrumentation libraries for popular programming languages, which can help developers quickly instrument their code.
- Integrate with Other Tools: Integrating OpenTelemetry with other tools, such as Proetheus and Jaeger, can provide a more comprehensive view of the CI/CD pipeline's performance.
- Collect Relevant Metrics: Collecting relevant metrics can help identify performance issues and other problems in the CI/CD pipeline. It's essential to collect metrics that are relevant to the specific use case and avoid collecting unnecessary data that can increase storage costs and make it more difficult to analyze the data.
- Set up proper CI/CD integration:It's also important to ensure that the CI/CD integration is done properly. This makes sure that the observability process carries out smoothly.
Conclusion
In conclusion, integrating OpenTelemetry into your CI/CD pipeline can significantly enhance observability, leading to faster issue detection, improved performance, and better decision-making. By following the best practices and analyzing the telemetry data effectively, you can optimize your CI/CD process, ensuring smooth and efficient software delivery.
The future of CI/CD observability with OpenTelemtry will be promising.It will be one of the most exciting areas of observability along with other major observability use cases like infrastructure monitoring and application performance monitoring. CI/CD is the foundation of modern production systems, so it’s crucial to apply the best practices we use for our production services. By making CI/CD observable we can achieve more efficiency, cost-effectiveness and better decision making.
Boost Your CI/CD Efficiency with Expert Guidance
Transform your CI/CD pipeline with advanced observability solutions. Get in touch for personalized OpenTelemetry support and consulting services.
