Introduction
Database monitoring is critical to managing modern applications, especially when databases form the backbone of your infrastructure. Effective monitoring ensures optimal performance, quick identification of bottlenecks, and proactive resolution of issues before they impact end users. Many databases such as MySQL, Postgres, Oracle, and MongoDB are popular, but PostgreSQL is the leading database in the startups recently funded in the past few years. Moreover, many companies also adopt Kubernetes to run their services. With the growing adoption of Kubernetes, many companies run PostgreSQL on Kubernetes with operators like CloudNativePG (CNPG) that offer benefits like easy scalability, high availability, backups, and seamless database management for modern, containerized environments. It also comes with monitoring as well. Recently, CloudNativePG has been accepted as a sandbox project in the CNCF ecosystem. For a more detailed introduction to cloud-native PostgreSQL and its features, check out our article on CloudNativePG.
This article explores implementing comprehensive monitoring for PostgreSQL using some open-source projects such as PGWatch.
PostgreSQL monitoring with PGWatch
PGWatch is a flexible PostgreSQL-specific monitoring solution, offering a comprehensive view of database performance and health. It provides a user-friendly interface through Grafana dashboards, allowing users to easily inspect various metrics and trends.
In the world of database management, monitoring plays a crucial role in ensuring stability, performance, and security with a constant need to keep databases healthy and responsive.
PGWatch is designed specifically for monitoring PostgreSQL databases and related infrastructure. It covers a wide range of components crucial for PostgreSQL ecosystems, including:
- PostgreSQL Databases: PGWatch monitors the core performance and health metrics of your PostgreSQL instances.
- Patroni Clusters: Monitor the health and performance of high-availability cluster members managed by Patroni.
- Connection Poolers (PgPool, PgBouncer): PGWatch provides insights into connection pooling with both PgPool and PgBouncer.
- Backup solutions: Track the performance and status of PgBackRest and WAL-G backups, ensuring that your backups are executed correctly.
This extended monitoring capability allows you to gain a comprehensive view of not only your PostgreSQL databases but also the surrounding infrastructure that supports and enhances your database operations.
What metrics are available for monitoring in PGWatch?
PGWatch provides out-of-the-box support for all essential PostgreSQL metrics, including:
- Database health checks
- Query performance
- Index usage
- Disk I/O
- CPU and memory consumption
- Locks, waits, and more.
In addition to the standard metrics, PGWatch can be easily extended to monitor custom metrics based on your specific needs. The solution offers flexibility to fine-tune monitoring details and the aggressiveness of data collection.
Demo: How to enable PGWatch to monitor the PostgreSQL database
Step 1: Set up the PostgreSQL database
In this step, we will run PostgreSQL in a Docker container and expose it on port 5433 to ensure the database is accessible. Additionally, we’ll configure PostgreSQL with custom settings for enhanced performance and monitoring.
Include the following parameters in the PostgreSQL configuration file.
shared_preload_libraries = 'pg_stat_statements'
track_io_timing = on
listen_addresses = '*'
sqlImportant: Create the my-postgres.conf file in the same directory where you will run the Docker commands. This ensures that the file is correctly mounted when starting the Docker container.
docker run -d \
  -p 5433:5432 \
  --name db-container \
  -v "$(pwd)/my-postgres.conf":/etc/postgresql/postgresql.conf \
  -e POSTGRES_PASSWORD=password \
  saurabhkr952/postgres:v12 \
  -c 'config_file=/etc/postgresql/postgresql.conf'
bash
Step 2: Deploy PGWatch
Run the PGWatch monitoring tool inside Docker container:
docker run -d --restart=unless-stopped --name pw3 -p 3000:3000 -p 8080:8080 cybertecpostgresql/pgwatch-demo:3.0.0
bash
Step 3: Create a monitoring user in PostgreSQL
To allow PGWatch to fetch metrics, you need a login user with limited privileges. Log in to the database as the postgres user:
docker exec -it db-container psql -U postgres
bash
Then, run the following SQL commands:
CREATE ROLE pgwatch2 WITH LOGIN PASSWORD 'secret';
ALTER ROLE pgwatch2 CONNECTION LIMIT 3;
GRANT pg_monitor TO pgwatch2;
GRANT CONNECT ON DATABASE postgres TO pgwatch2;
GRANT EXECUTE ON FUNCTION pg_stat_file(text) to pgwatch2; -- for wal_size metric
sql
Step 4: Connect the database to PGWatch and configure metrics
Go to http://localhost:8080 and log in using the default credentials: username: admin password: admin
This is the connection string format:
postgresql://<username>:<password>@<host>:<port>/<database_name>
bash
Add a new connection string with the following URL:
postgresql://postgres:[email protected]:5433/postgres
bashNote: Since PostgreSQL is running inside a Docker container using the bridge network driver, we've used Docker's default bridge network IP 172.17.0.1 instead of the localhost.
Then Navigate to the METRICS tab and select the Full metrics preset.

Step 5: Visualize PGWatch metrics in Grafana
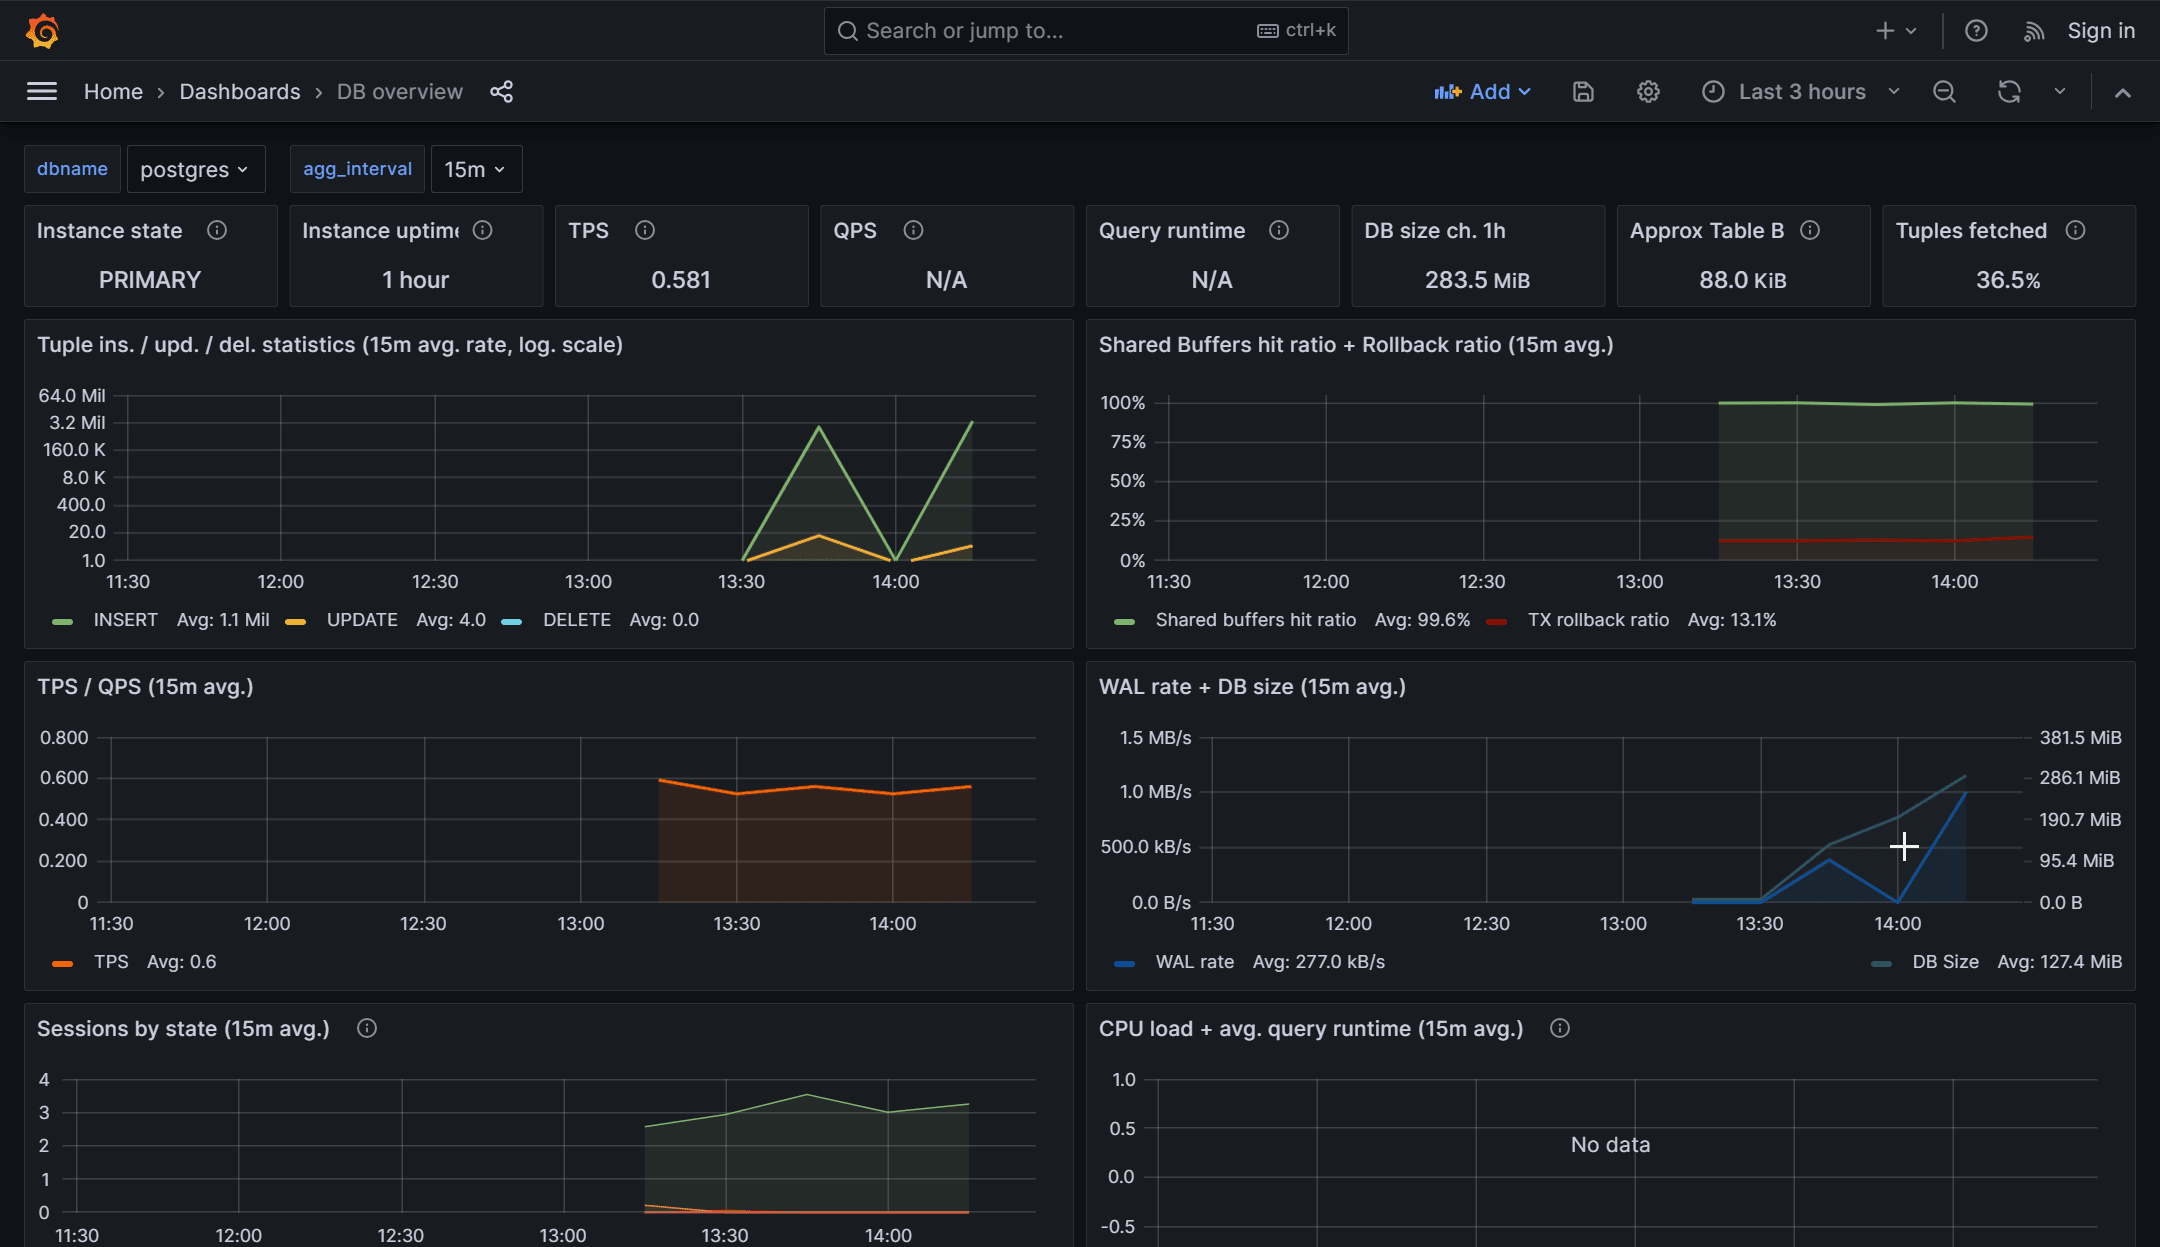
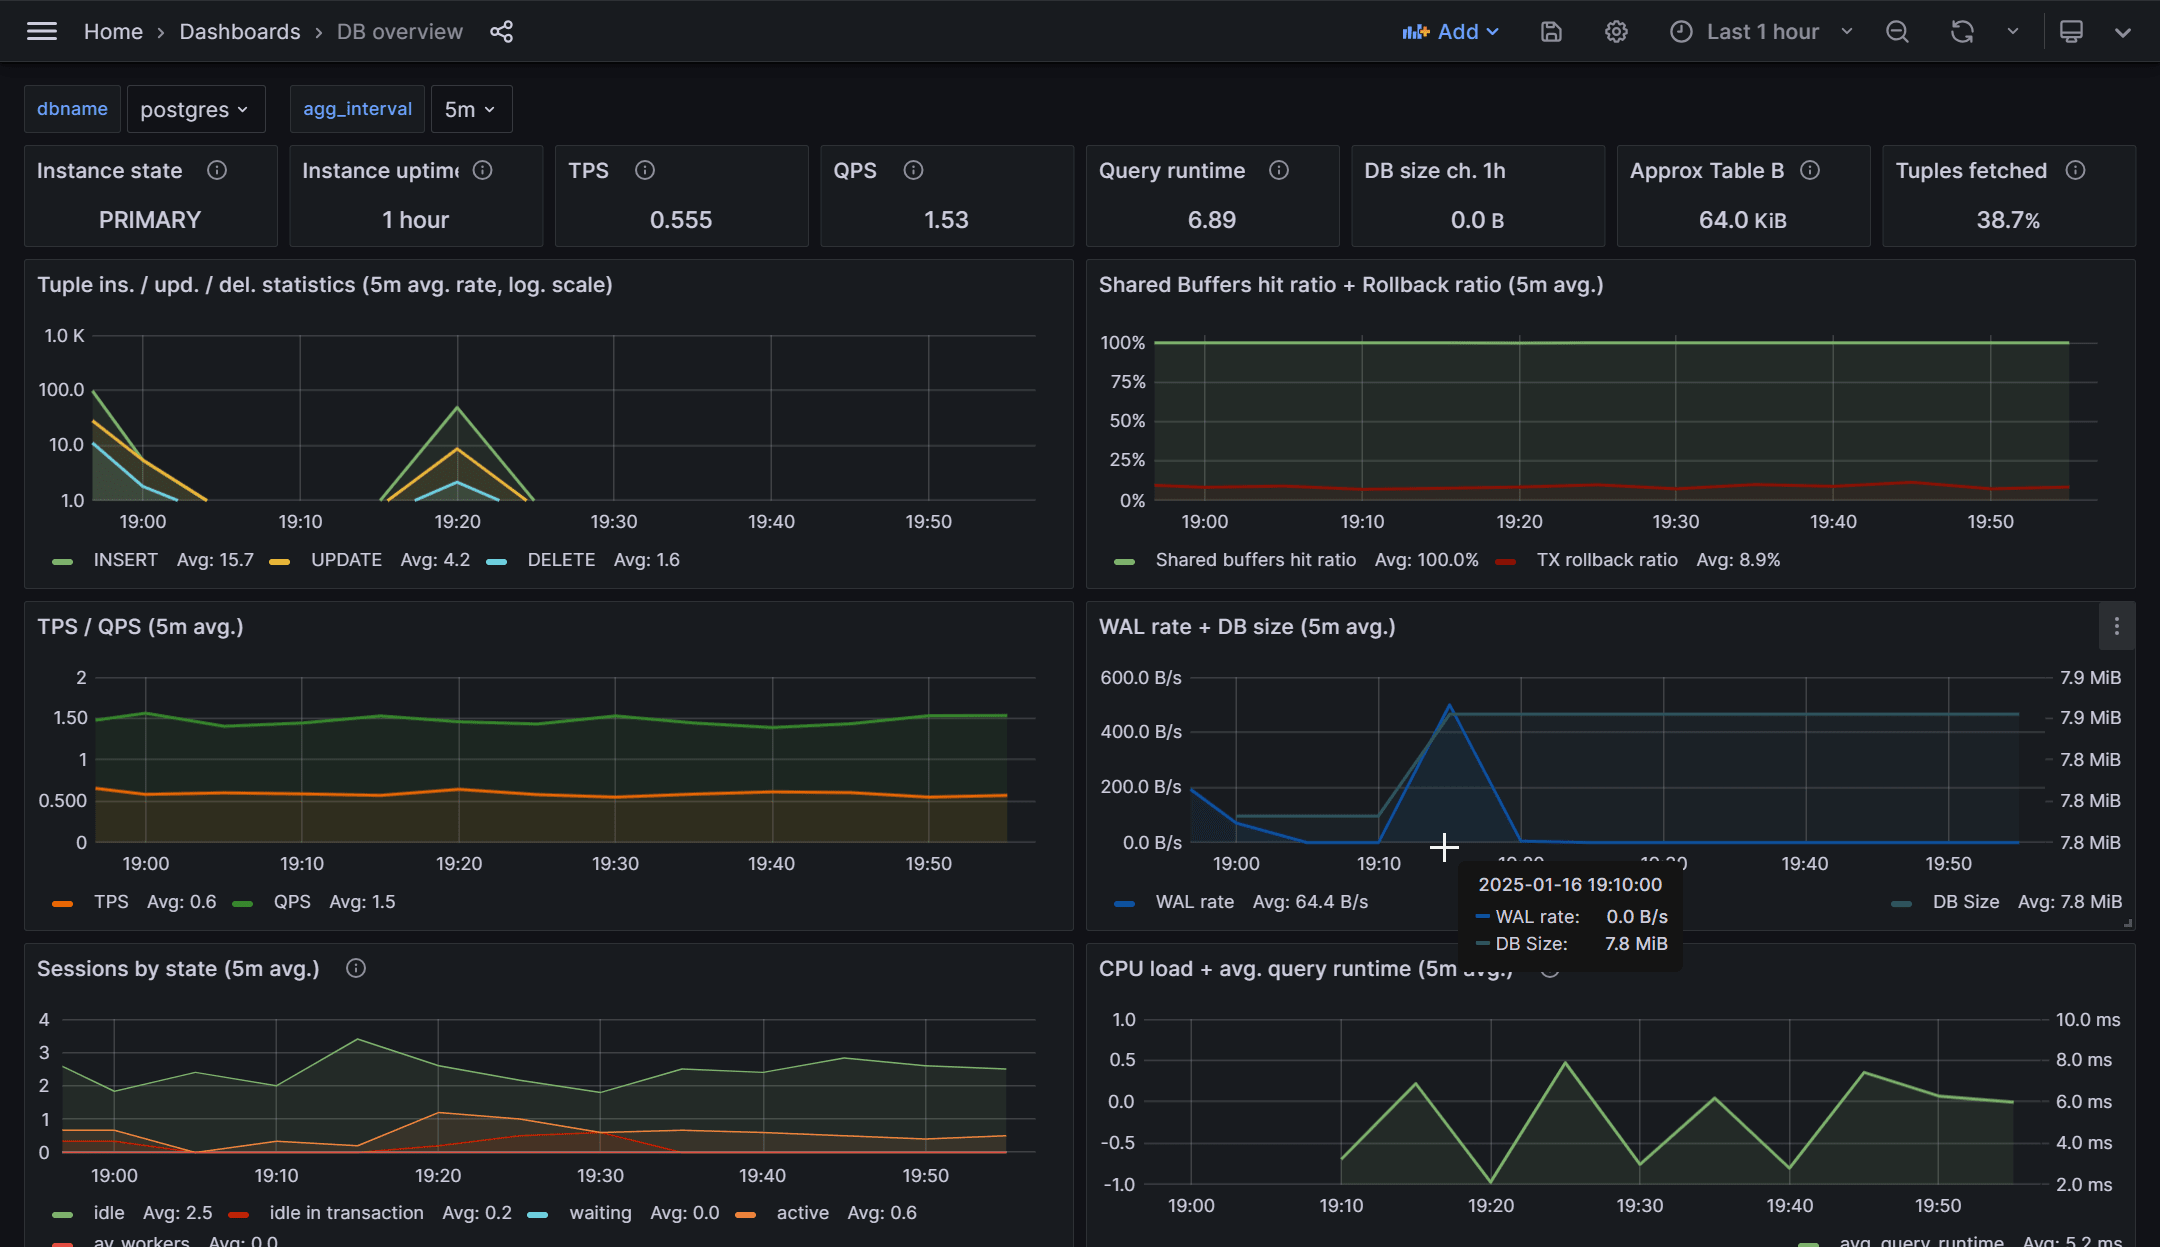
Open your browser and navigate to http://localhost:3000, where Grafana is running. Explore the PGWatch dashboard to visualize the metrics collected from PostgreSQL.


You may see some metrics are not available in PGWatch by default. We need to enable them by using the pg_stat_statements extension, which provides detailed query performance data, such as the "QPS" (queries per second), Query Runtime metrics, and powers dashboards like "Stat Statements Top." Additionally, enabling the track_io_timing setting helps with I/O performance troubleshooting.
Postgres knows very little about the Operating System it's running on, so in some (most) cases, it might be advantageous to monitor some basic OS statistics together. Adding enabling helper functions helps.
Helper functions in PGWatch context are standard Postgres stored procedures, running under SECURITY DEFINER privileges. Via such wrapper functions, one can do controlled privilege escalation - i.e., to give access to protected Postgres metrics (like active session details, "per query" statistics) or even OS-level metrics, to normal unprivileged users, like the PGWatch monitoring role.
Let’s see how we can enable helpers in our PostgreSQL database.
To enter the PostgreSQL database container, use the following command:
docker exec -it db-container /bin/bash
bash
Then run these commands to enable common helpers:
git clone https://github.com/cybertec-postgresql/pgwatch2.git
psql -U postgres -f pgwatch2/pgwatch2/metrics/00_helpers/get_stat_activity/9.2/metric.sql postgres
psql -U postgres -f pgwatch2/pgwatch2/metrics/00_helpers/get_stat_replication/9.2/metric.sql postgres
psql -U postgres -f pgwatch2/pgwatch2/metrics/00_helpers/get_wal_size/10/metric.sql postgres
psql -U postgres -c "REVOKE CREATE ON SCHEMA public FROM PUBLIC;"
psql -U postgres -f pgwatch2/pgwatch2/metrics/00_helpers/get_stat_statements/9.4/metric.sql postgres
psql -U postgres -f pgwatch2/pgwatch2/metrics/00_helpers/get_sequences/10/metric.sql postgres
bash
Installing Python bindings for PostgreSQL to install PL/Python helpers
To install the necessary Python bindings for PostgreSQL, run the following commands on your VM (Note: These bindings are already installed in the PostgreSQL container):
sudo apt install postgresql-plpython3-12
yum install postgresql12-plpython3
bash
Enabling plpython3u Extension & Execute the Following Commands
psql -U postgres -c "CREATE EXTENSION plpython3u"
psql -U postgres -f pgwatch2/pgwatch2/metrics/00_helpers/get_load_average/9.1/metric.sql postgres
bash
Installing psutil Helpers
The psutil helpers are required if you want to collect a full set of OS-level metrics. To install psutil, run the following command:
sudo apt install python3-psutil
bash
Once psutil is installed, run the following commands to install the PL/Python helpers:
psql -U postgres -f /pgwatch2/pgwatch2/metrics/00_helpers/get_psutil_cpu/9.1/metric.sql postgres
psql -U postgres -f pgwatch2/pgwatch2/metrics/00_helpers/get_psutil_mem/9.1/metric.sql postgres
psql -U postgres -f pgwatch2/pgwatch2/metrics/00_helpers/get_psutil_disk/9.1/metric.sql postgres
psql -U postgres -f pgwatch2/pgwatch2/metrics/00_helpers/get_psutil_disk_io_total/9.1/metric.sql postgres
bash
Alerting
Monitoring without alerting can lead to delayed responses to critical database issues. With tools like PGWatch and Grafana, you can configure alerts to notify your team about potential problems proactively. This ensures faster resolution and minimizes downtime.
Step 1: Setting up Alerts in Grafana
Here’s how to set up an alert for high query latency. This rule will notify you if the query duration exceeds a certain threshold, which can indicate a performance bottleneck.
Example SQL Query for High Query Latency Alert
SELECT
  COALESCE(MAX((data ->> 'longest_query_seconds') :: int), 0) AS longest_query_seconds,
  COALESCE(MAX(data ->> 'query'), 'query') AS longest_query
FROM
  backends
WHERE
  time > NOW() - '300' :: interval
  AND dbname = 'postgres';
sql
Step 2: Configure Alert thresholds
In Grafana, go to the dashboard panel where the query is visualized. Click on the Alert tab to configure the alert rule. Set the threshold to 10 seconds (or whatever threshold you consider as the limit for high query latency).
Example Alert Summary
- Threshold: 10 seconds
- Alert Summary: 🚨 High query latency detected 🚨
- Alert Description: Longest Query Duration:
{{ labels.longest_query }}sec - Labels: Severity: Warning, Database: Postgres
Inserting random MD5 hashes to simulate high query latency
First, enter inside db:
docker exec -it db-container psql -U postgres
bash
Create the Table
CREATE TABLE md5_table (
    id SERIAL PRIMARY KEY,
    md5_column TEXT
);
sql
Inserting random MD5 hashes in a loop to increase the query time
This script generates random MD5 hashes and inserts them into the table, simulating a scenario where query latency increases.
DO $$
DECLARE
    i INT := 0;
    random_md5 TEXT;
BEGIN
    FOR i IN 1..100000000 LOOP  -- Loop 100 million times
        random_md5 := md5(random()::text);  -- Generate a random MD5 hash
        INSERT INTO md5_table (md5_column)  -- Replace with your table and column name
        VALUES (random_md5);  -- Insert the random MD5 hash
    END LOOP;
END $$;
sql
Step 3: Trigger the Alert
As the script runs and increases the query time, Grafana will trigger the alert if the query latency exceeds the set threshold. You’ll receive a notification, which can help you respond quickly to resolve the issue.
Monitoring CloudNativePG in Kubernetes
Step 1: Install Prometheus stack
Add the Prometheus Helm chart repository and deploy the kube-prometheus-stack:
helm repo add prometheus-community \
  https://prometheus-community.github.io/helm-charts

helm upgrade --install \
  -f https://raw.githubusercontent.com/cloudnative-pg/cloudnative-pg/main/docs/src/samples/monitoring/kube-stack-config.yaml \
  prometheus-community \
  prometheus-community/kube-prometheus-stack
bash
Step 2: Enable monitoring for CloudNativePG
Update your CloudNativePG Cluster resource YAML to enablePodMonitor: true
Below given example.
apiVersion: postgresql.cnpg.io/v1
kind: Cluster
metadata:
  name: cluster-with-metrics
spec:
  instances: 3
  storage:
    size: 1Gi
  monitoring:
    enablePodMonitor: true
yaml
Step 3: Configure PostgreSQL for monitoring
To collect detailed statistics, ensure the following settings are added to your PostgreSQL configuration postgresql.conf:
shared_preload_libraries = 'pg_stat_statements'
track_io_timing = on
listen_addresses = '*'
sql
Step 4: Access Grafana dashboard
Port-forward the Grafana service and import the CloudNativePG dashboard:
kubectl port-forward svc/prometheus-community-grafana 3000:80
bash- Open http://localhost:3000 in your browser.
- In Grafana, go to Create -> Import.
- Enter dashboard ID
20417in the Import via grafana.com field. - Click Load and then Import to view the CloudNativePG dashboard.
Alternative monitoring solutions
There are various other projects that are useful in Postgres monitoring. Some of them are commercial ones:
New Relic
New Relic is a commercial tool that provides robust monitoring capabilities for PostgreSQL. Its PostgreSQL on-host integration captures essential database metrics and sends them to the New Relic platform, where they can be aggregated, visualized, and analyzed. This integration is designed to give you deep insights into your PostgreSQL instance’s performance, allowing you to quickly identify bottlenecks and issues.
Key features:
- Supported Managed Services: One of the standout features of New Relic is its compatibility with cloud-based managed services like Amazon RDS and Azure Flexible Database, making it easy to monitor databases hosted in the cloud.
- Cross-Platform Support: The tool is highly versatile, supporting PostgreSQL on operating systems such as Linux and Windows, as well as in environments like virtual machines (VMs), Kubernetes, and Amazon ECS (Elastic Container Service).
Pganalyze
Pganalyze is a dedicated PostgreSQL tool designed to help you monitor and optimize the performance of your PostgreSQL databases. It focuses on providing in-depth, actionable insights into query performance, slow queries, index usage, and more. Pganalyze offers both cloud and on-premise options to suit different deployment preferences.
Key features:
- Query Performance Analysis: Understand why a query is slow and get tuning recommendations on how to make the query faster.
- Index and Vacuum Insights: Pganalyze will highlight why a slow query is slow and whether an index can be created to make the query perform faster.
- Supports Managed Services:
- AWS RDS, Aurora
- Microsoft Flexible Server & Cosmos DB
- Google AlloyDB & Cloud SQL
- Heroku Postgres & Self-Managed, VMs more.
Postgres Exporter for Prometheus
The Postgres Exporter for Prometheus is another popular solution for monitoring PostgreSQL. It is used to expose PostgreSQL metrics in a format that can be scraped by Prometheus, a powerful time-series database and monitoring system.
The Postgres Exporter collects various PostgreSQL metrics, such as:
- Current QPS
- Fetched, Returned, Inserted, Updated, Deleted Rows
- Database Deadlocks and Conflicts
- Cache Hit Ratio
- Number of Active Connections Buffers
However, PostgreSQL by itself doesn't have direct knowledge of system-level metrics such as CPU, memory, disk usage, and network stats so you'll need to combine the Postgres Exporter with additional exporters (such as the Node Exporter for system metrics) in your Prometheus setup.
Both the Postgres Exporter and the Node Exporter come with pre-built Grafana dashboards that allow you to visualize key metrics for your PostgreSQL database and system in real time. These dashboards are highly customizable. Additionally, the Postgres Exporter comes with pre-built alerting rules that can be set up in Prometheus to notify you of critical issues.
Conclusion
In today’s cloud-native applications, PostgreSQL has become a go-to choice for managing data. To ensure smooth and uninterrupted performance, effective database monitoring is crucial. Monitoring helps identify potential issues before they impact your users, enabling proactive resolution and minimizing downtime.
This article covered a range of powerful monitoring solutions, including both commercial and open-source tools, that serve different infrastructure needs. Whether your PostgreSQL instance is running on Kubernetes, cloud-managed databases, virtual machines, or self-hosted environments, these tools offer flexibility and adaptability to monitor any setup. Few tools even help you to optimize the performance of queries as well.
By adopting a comprehensive monitoring strategy with proactive alerting, teams can quickly detect and address issues before they escalate. Continuous monitoring not only ensures optimal query performance and system health but also supports the scalability of your PostgreSQL database as your application evolves and grows.
Engage our team who is well versed in databases, cloud native and observability to discuss your case. Our experts are happy to talk to you.


